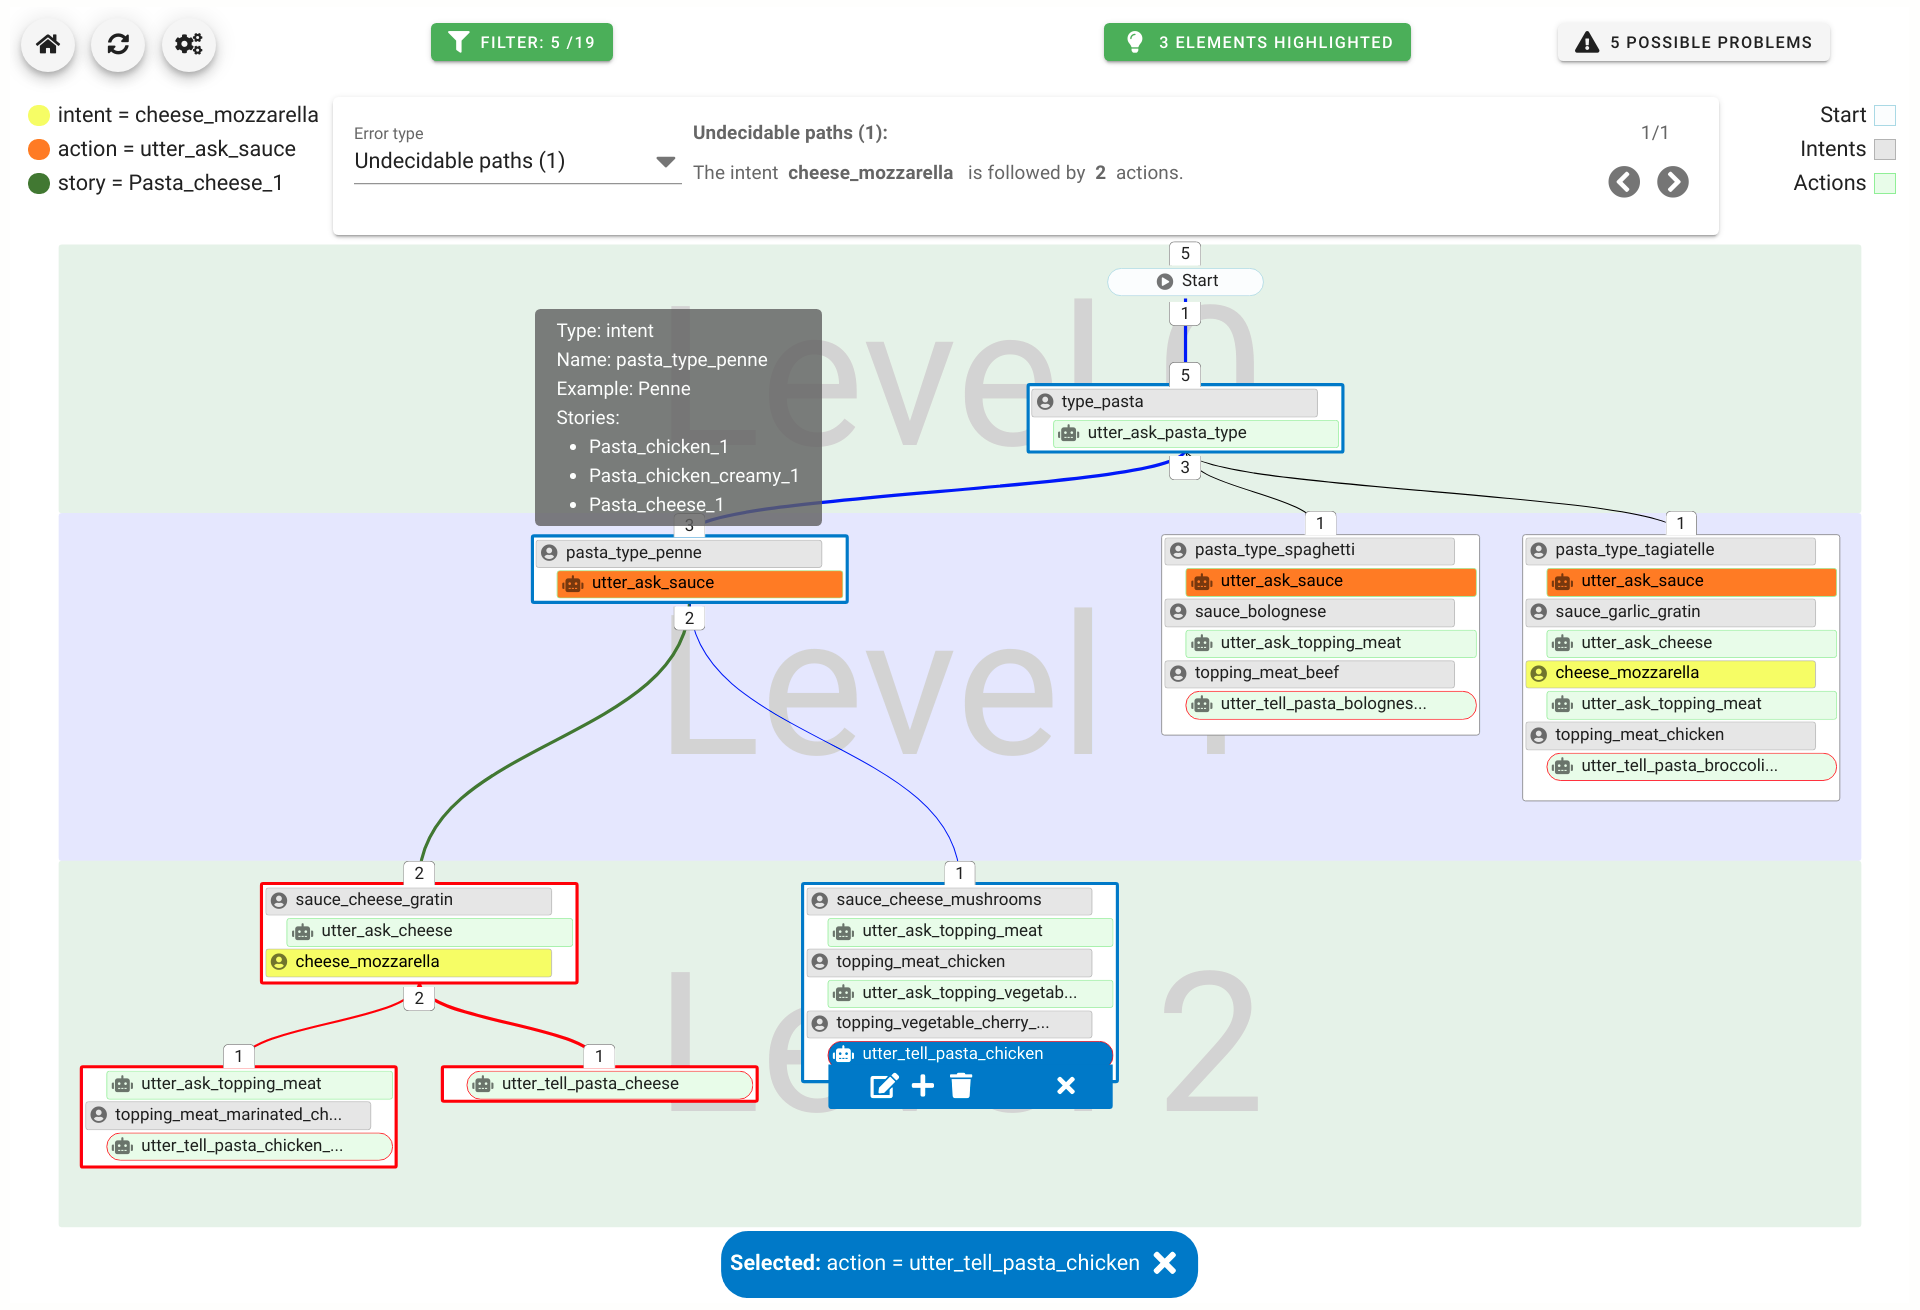
A chatbot can automatically process a user's request, e.g. to provide a requested information. In doing so, the user starts a conversation with the chatbot and can specify the request by further inquiry. Due to the developments in the field of NLP in recent years, algorithmic text comprehension has been significantly improved. As a result, chatbots are increasingly used by companies and other institutions for various tasks such as order processes or service requests. Knowledge bases are often used to answer users queries, but these are usually curated manually in various text files, prone to errors. Visual methods can help the expert to identify common problems in the knowledge base and can provide an overview of the chatbot system. In this paper, we present Chatbot Explorer, a system to visually assist the expert to understand, explore, and manage a knowledge base of different chatbot systems. For this purpose, we provide a tree-based visualization of the knowledge base as an overview. For a detailed analysis, the expert can use appropriate visualizations to drill down the analysis to the level of individual elements of a specific story to identify problems within the knowledge base. We support the expert with automatic detection of possible problems, which can be visually highlighted. Additionally, the expert can also change the order of the queries to optimize the conversation lengths and it is possible to add new content. To develop our solution, we have conducted an iterative design process with domain experts and performed two user evaluations. The evaluations and the feedback from our domain experts have shown that our solution can significantly improve the maintainability of chatbot knowledge bases.
Accepted as Fullpaper at WSCG 2022.


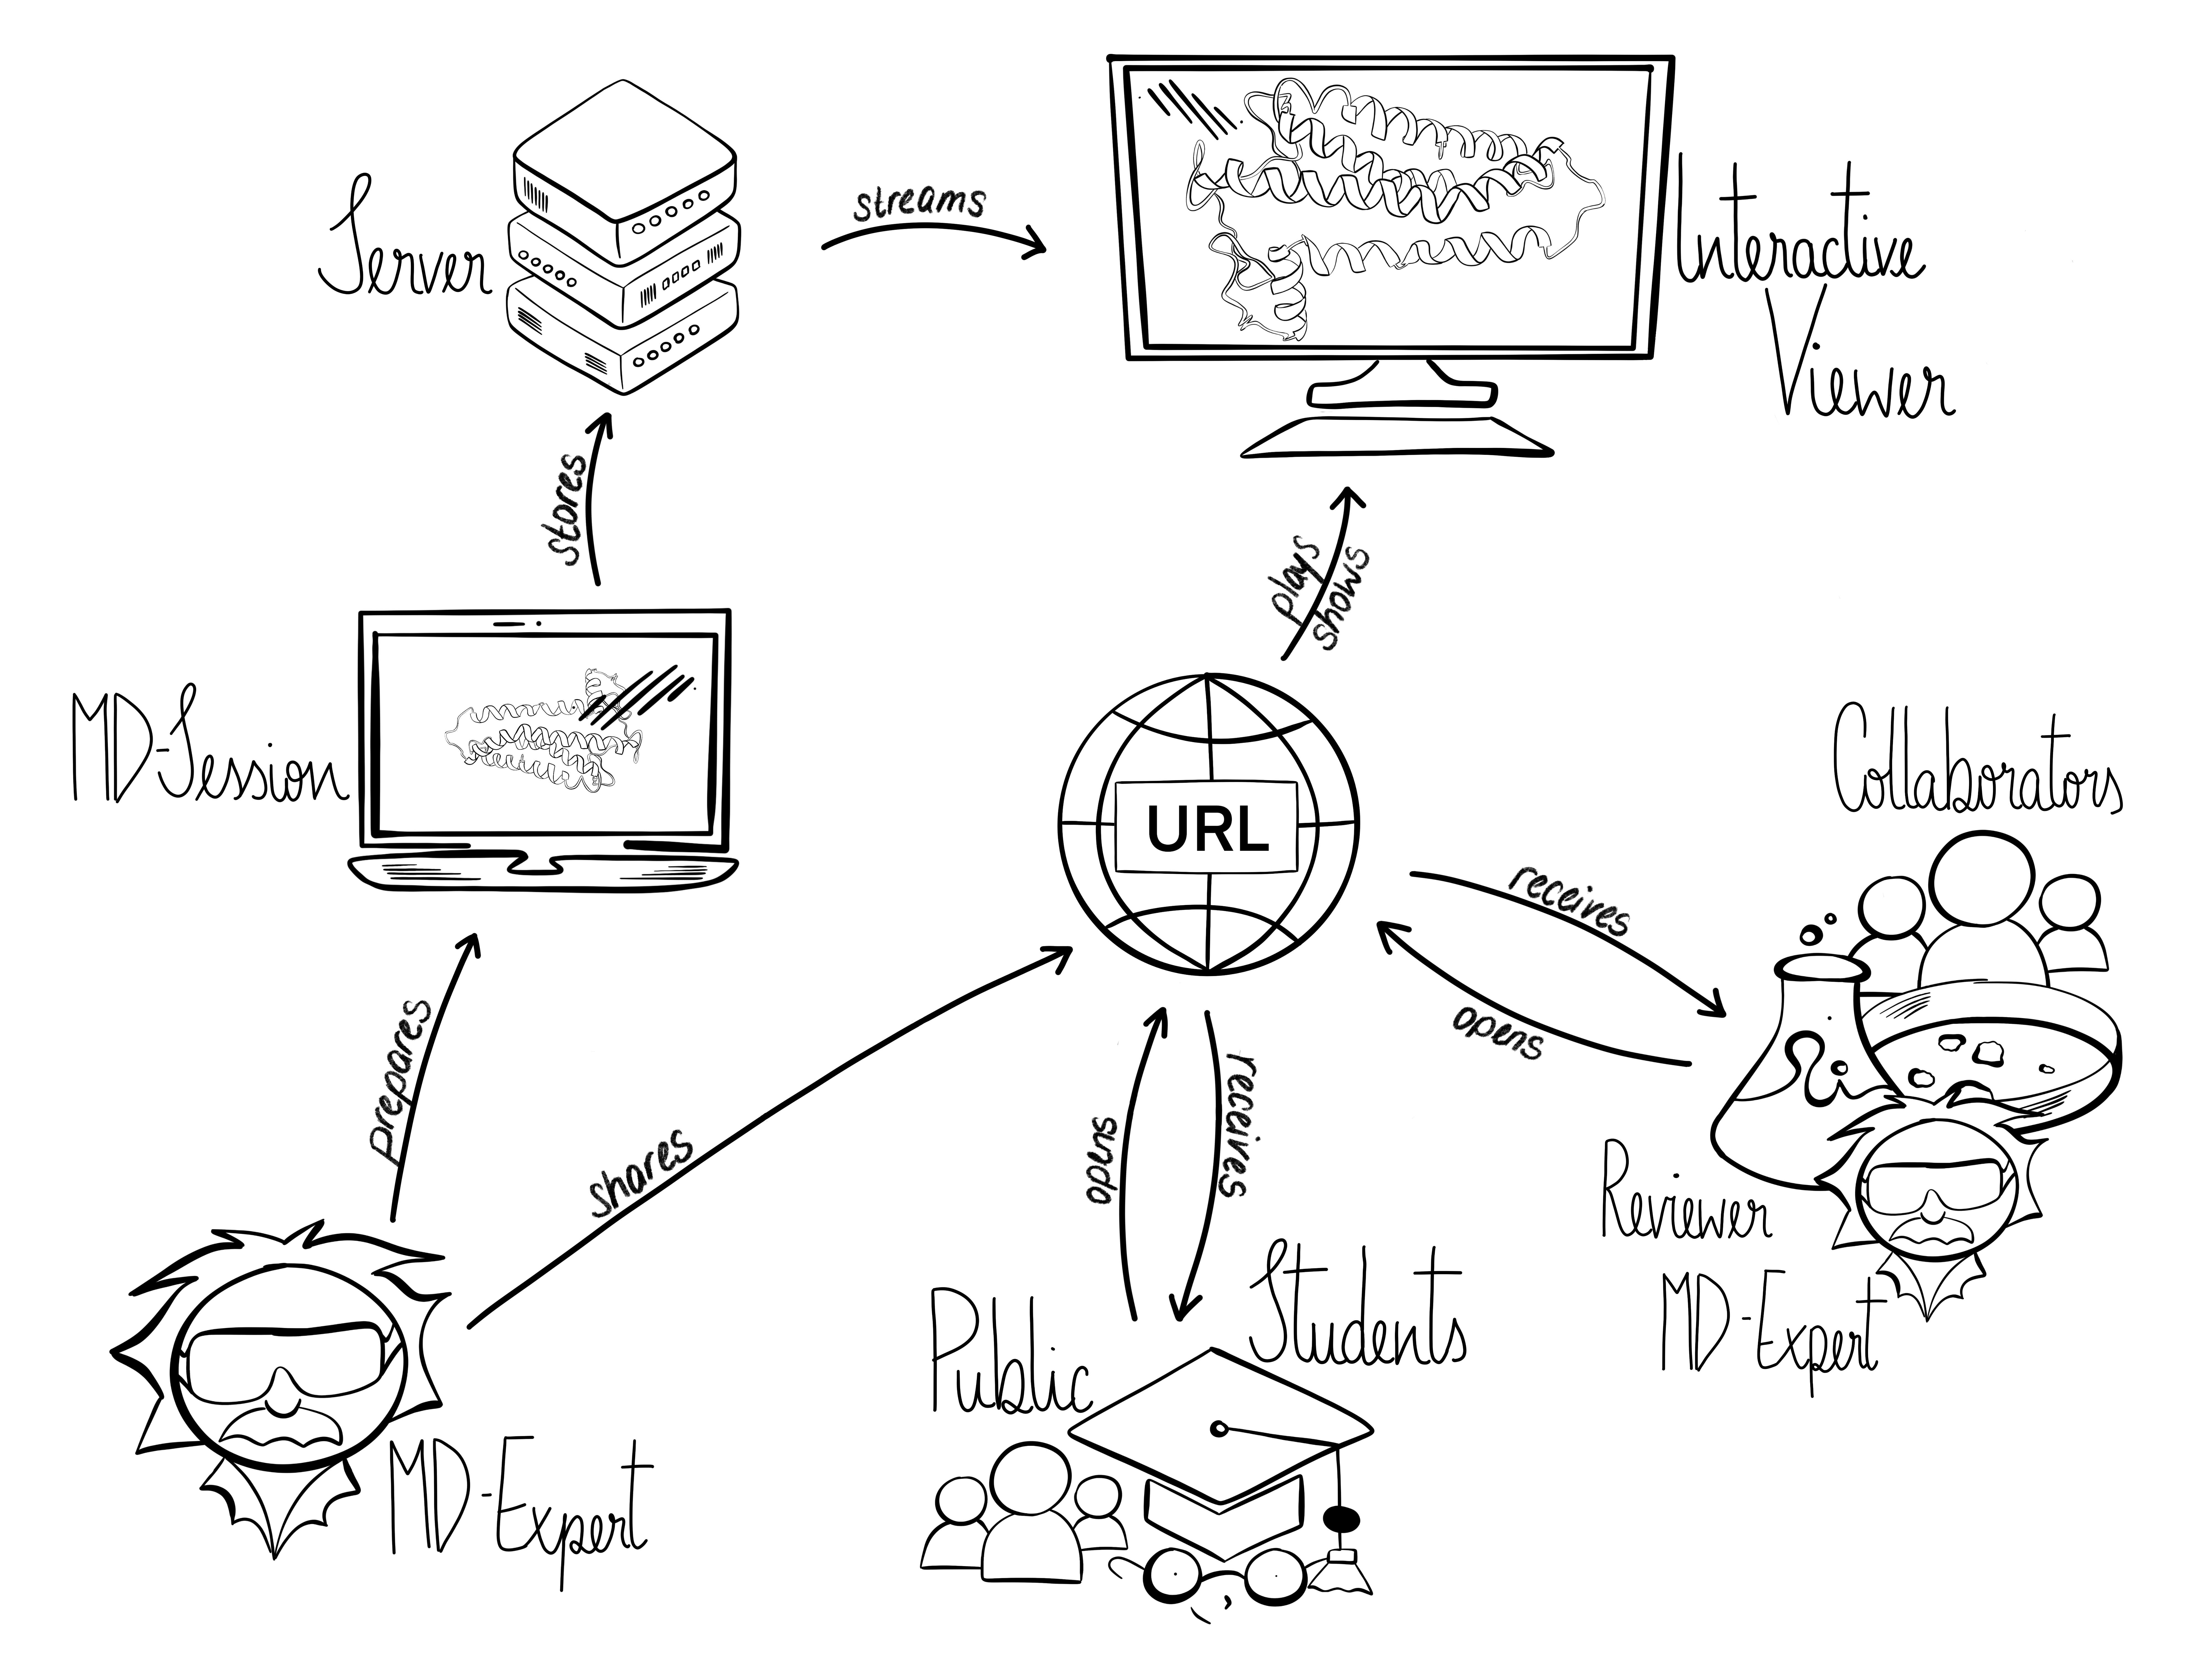
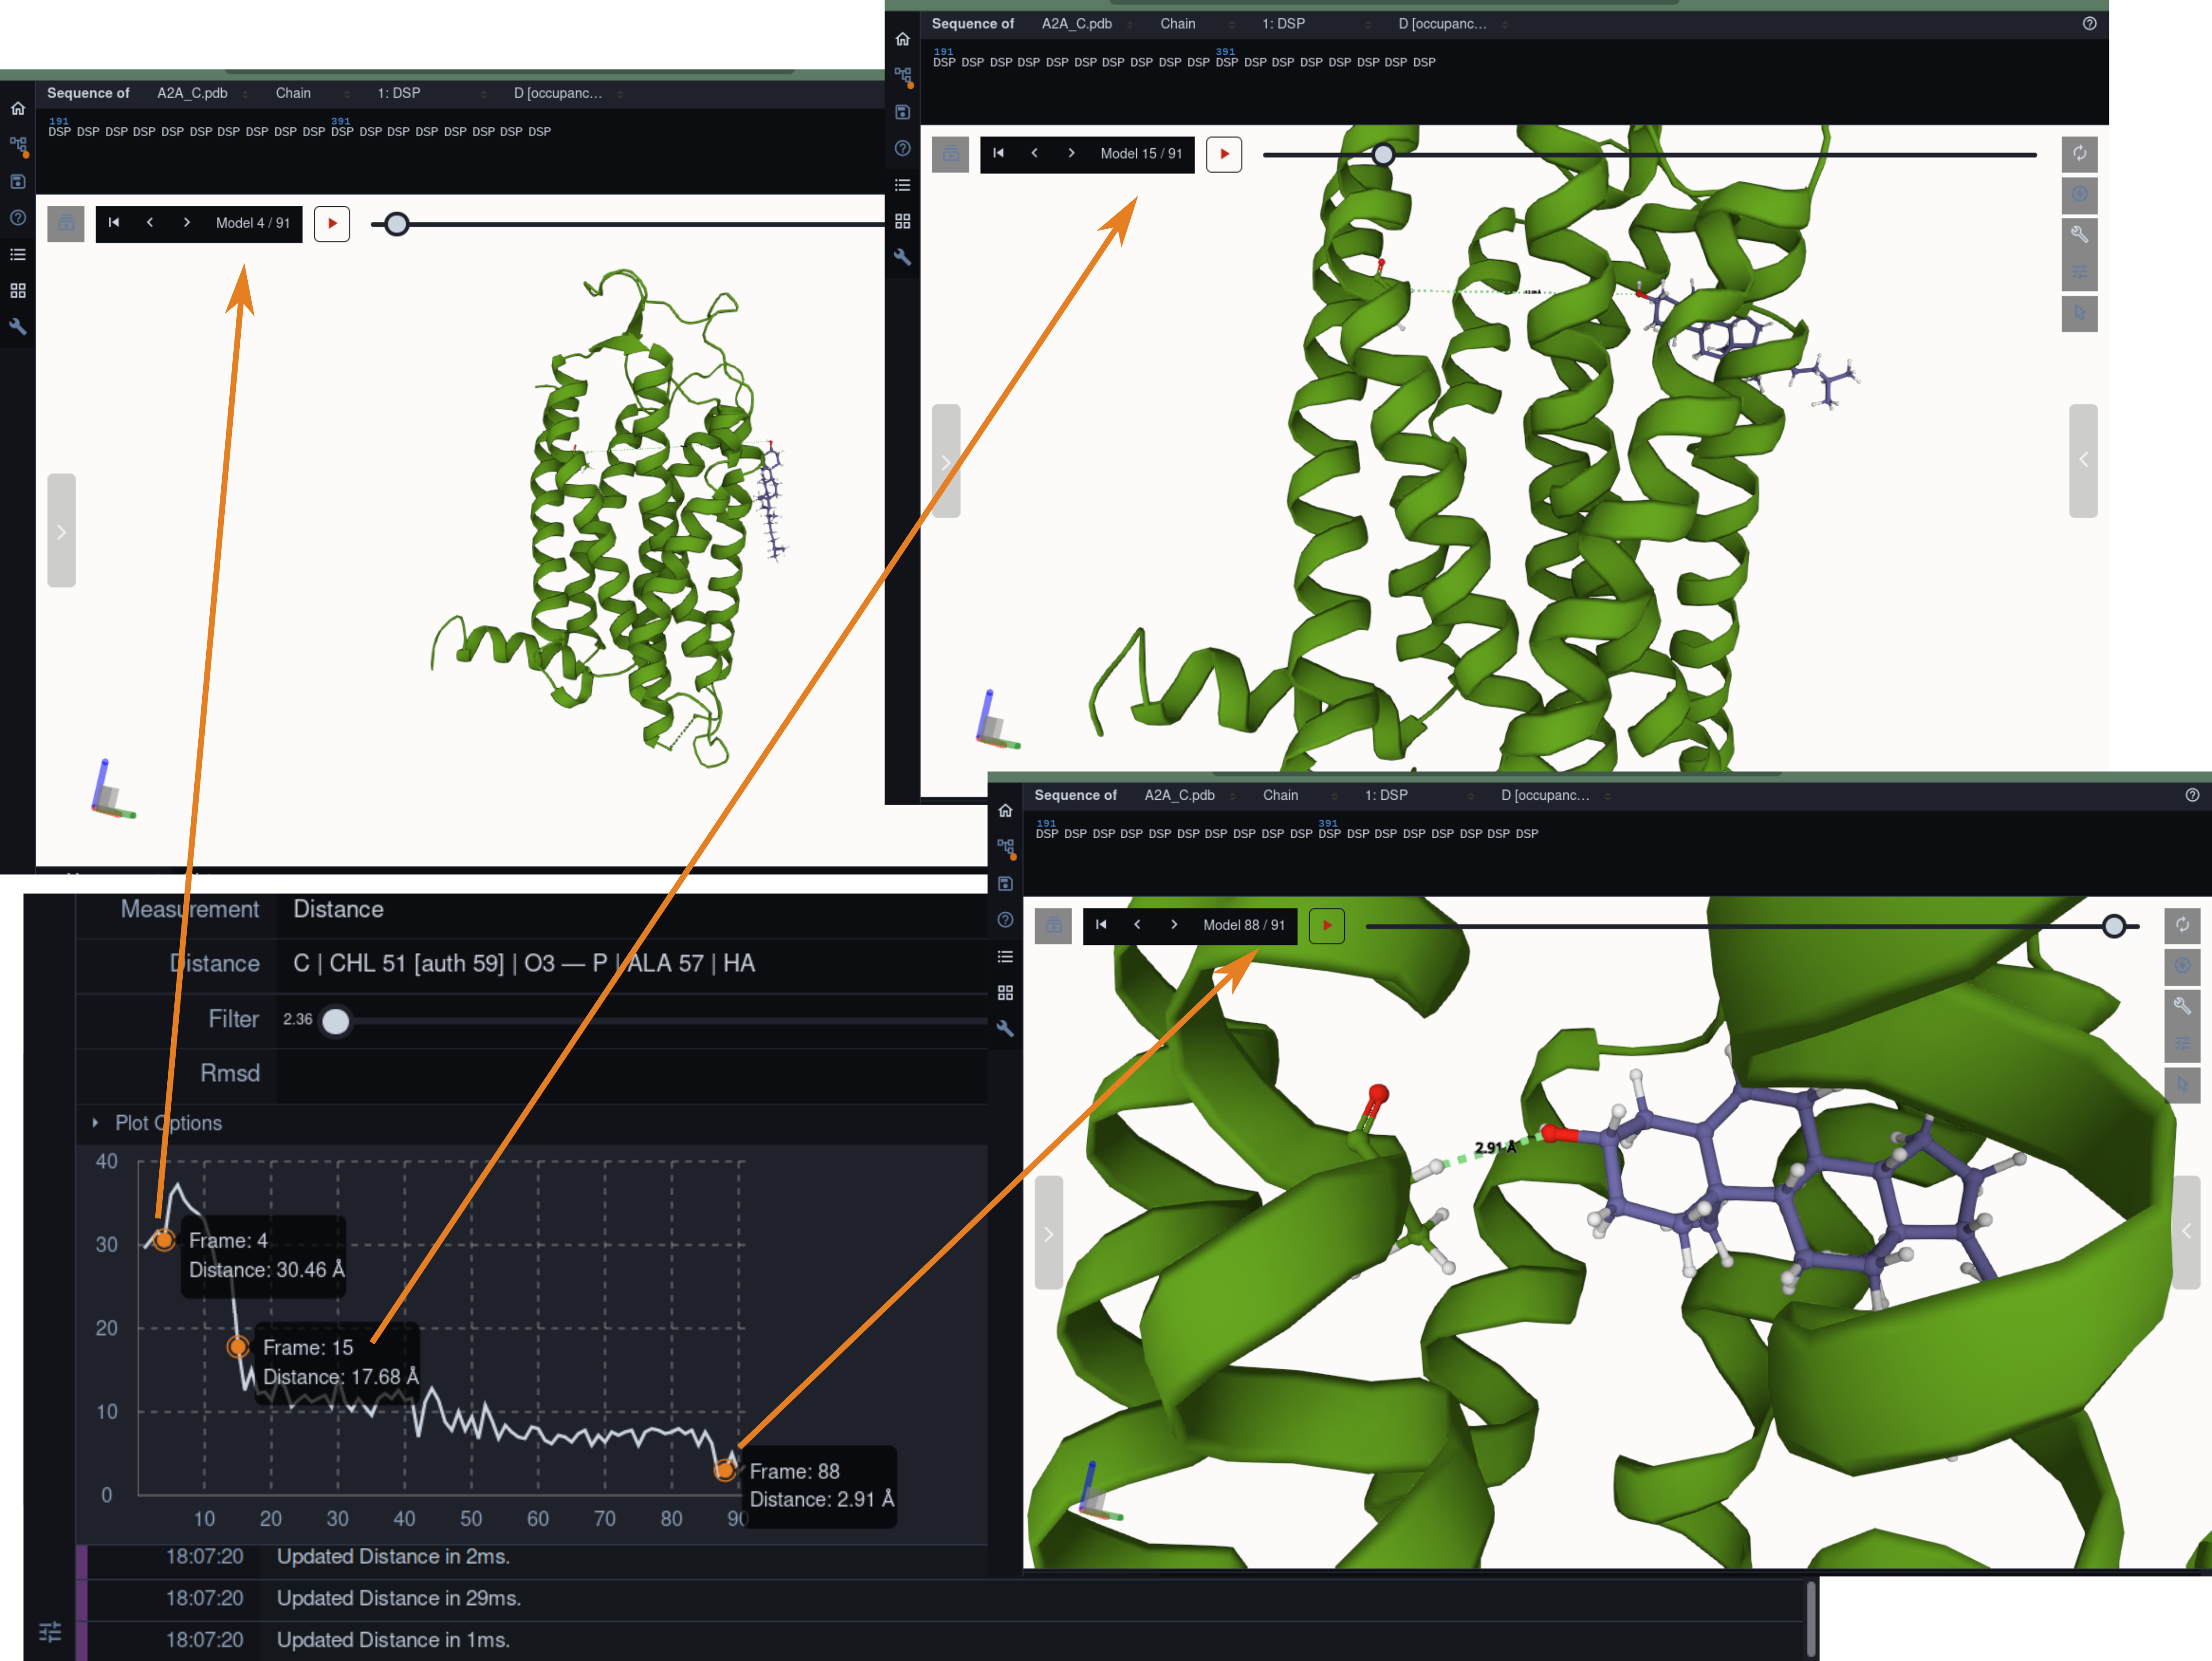
Molecular dynamics simulation is a proven technique for computing and visualizing the time-resolved motion of macromolecules at atomic resolution. The MDsrv is a tool that streams MD trajectories and displays them interactively in web browsers without requiring advanced skills, facilitating interactive exploration and collaborative visual analysis. We have now enhanced the MDsrv to further simplify the upload and sharing of MD trajectories and improve their online viewing and analysis. With the new instance, the MDsrv simplifies the creation of sessions, which allows the exchange of MD trajectories with preset representations and perspectives. An important innovation is that the MDsrv can now access and visualize trajectories from remote datasets, which greatly expands its applicability and use, as the data no longer needs to be accessible on a local server. In addition, initial analyses such as sequence or structure alignments, distance measurements, or RMSD calculations have been implemented, which optionally support visual analysis. Finally, based on Mol*, MDsrv now provides faster and more efficient visualization of even large trajectories compared to its predecessor tool NGL.

Land Reuse processes are large planning and decision-making processes based on a large amount of geographic data. Therefore, it is essential that this data is as accurate as possible. However, errors can occur during the creation of the data and not all of them are directly noticeable. We report here what errors we have encountered while working with this geographic data, what problems they can cause, and how we have fixed them. Since the correction can be very time-consuming with the enormous amount of data, we have focused on an automatic correction. Not all of this data can be corrected this way, for the rest, we briefly indicate a procedure to support and simplify the manual correction.


Open pit mines left many regions worldwide inhospitable or uninhabitable. Many sites are left behind in a hazardous or contaminated state, show remnants of waste, or have other restrictions imposed upon them, e.g., for the protection of human or nature. Such information has to be permanently managed in order to reuse those areas in the future. In this work we present and evaluate an automated workflow for supporting the post-mining management of former lignite open pit mines in the eastern part of Germany, where prior to any planned land reuse, aforementioned information has to be acquired to ensure the safety and validity of such an endeavor. Usually, this information is found in expert reports, either in the form of paper documents, or in the best case as digitized unstructured text—all of them in German language. However, due to the size and complexity of these documents, any inquiry is tedious and time-consuming, thereby slowing down or even obstructing the reuse of related areas. Since no training data is available, we employ active learning in order to perform multi-label sentence classification for two categories of restrictions and seven categories of topics. The final system integrates optical character recognition (OCR), active-learning-based text classification, and geographic information system visualization in order to effectively extract, query, and visualize this information for any area of interest. Active learning and text classification results are twofold: Whereas the restriction categories were reasonably accurate (>0.85 F1), the seven topic-oriented categories seemed to be complex even for human annotators and achieved mediocre evaluation scores (<0.70 F1).
, and the other by Johannes Kazah (right background, CC BY-SA 2.0). The resulting image changes
the originals only by adding overlays (to the front) and is also licensed under the CC BY-SA 2.0 license.)")
 Two geographic features of type 'active dismantling' are displayed on a map. One feature was
selected by mouse click (orange striped texture). The weather map is shown as isobands, with precipitation values
represented by shades of blue (dark blue tones indicate areas with high precipitation values). The information
panel is displayed on the right hand side. It contains the non-spatial data of the selected geographic feature (B), as
well as the usage restrictions together with a list of other features with similar usage restrictions (C).")
Background
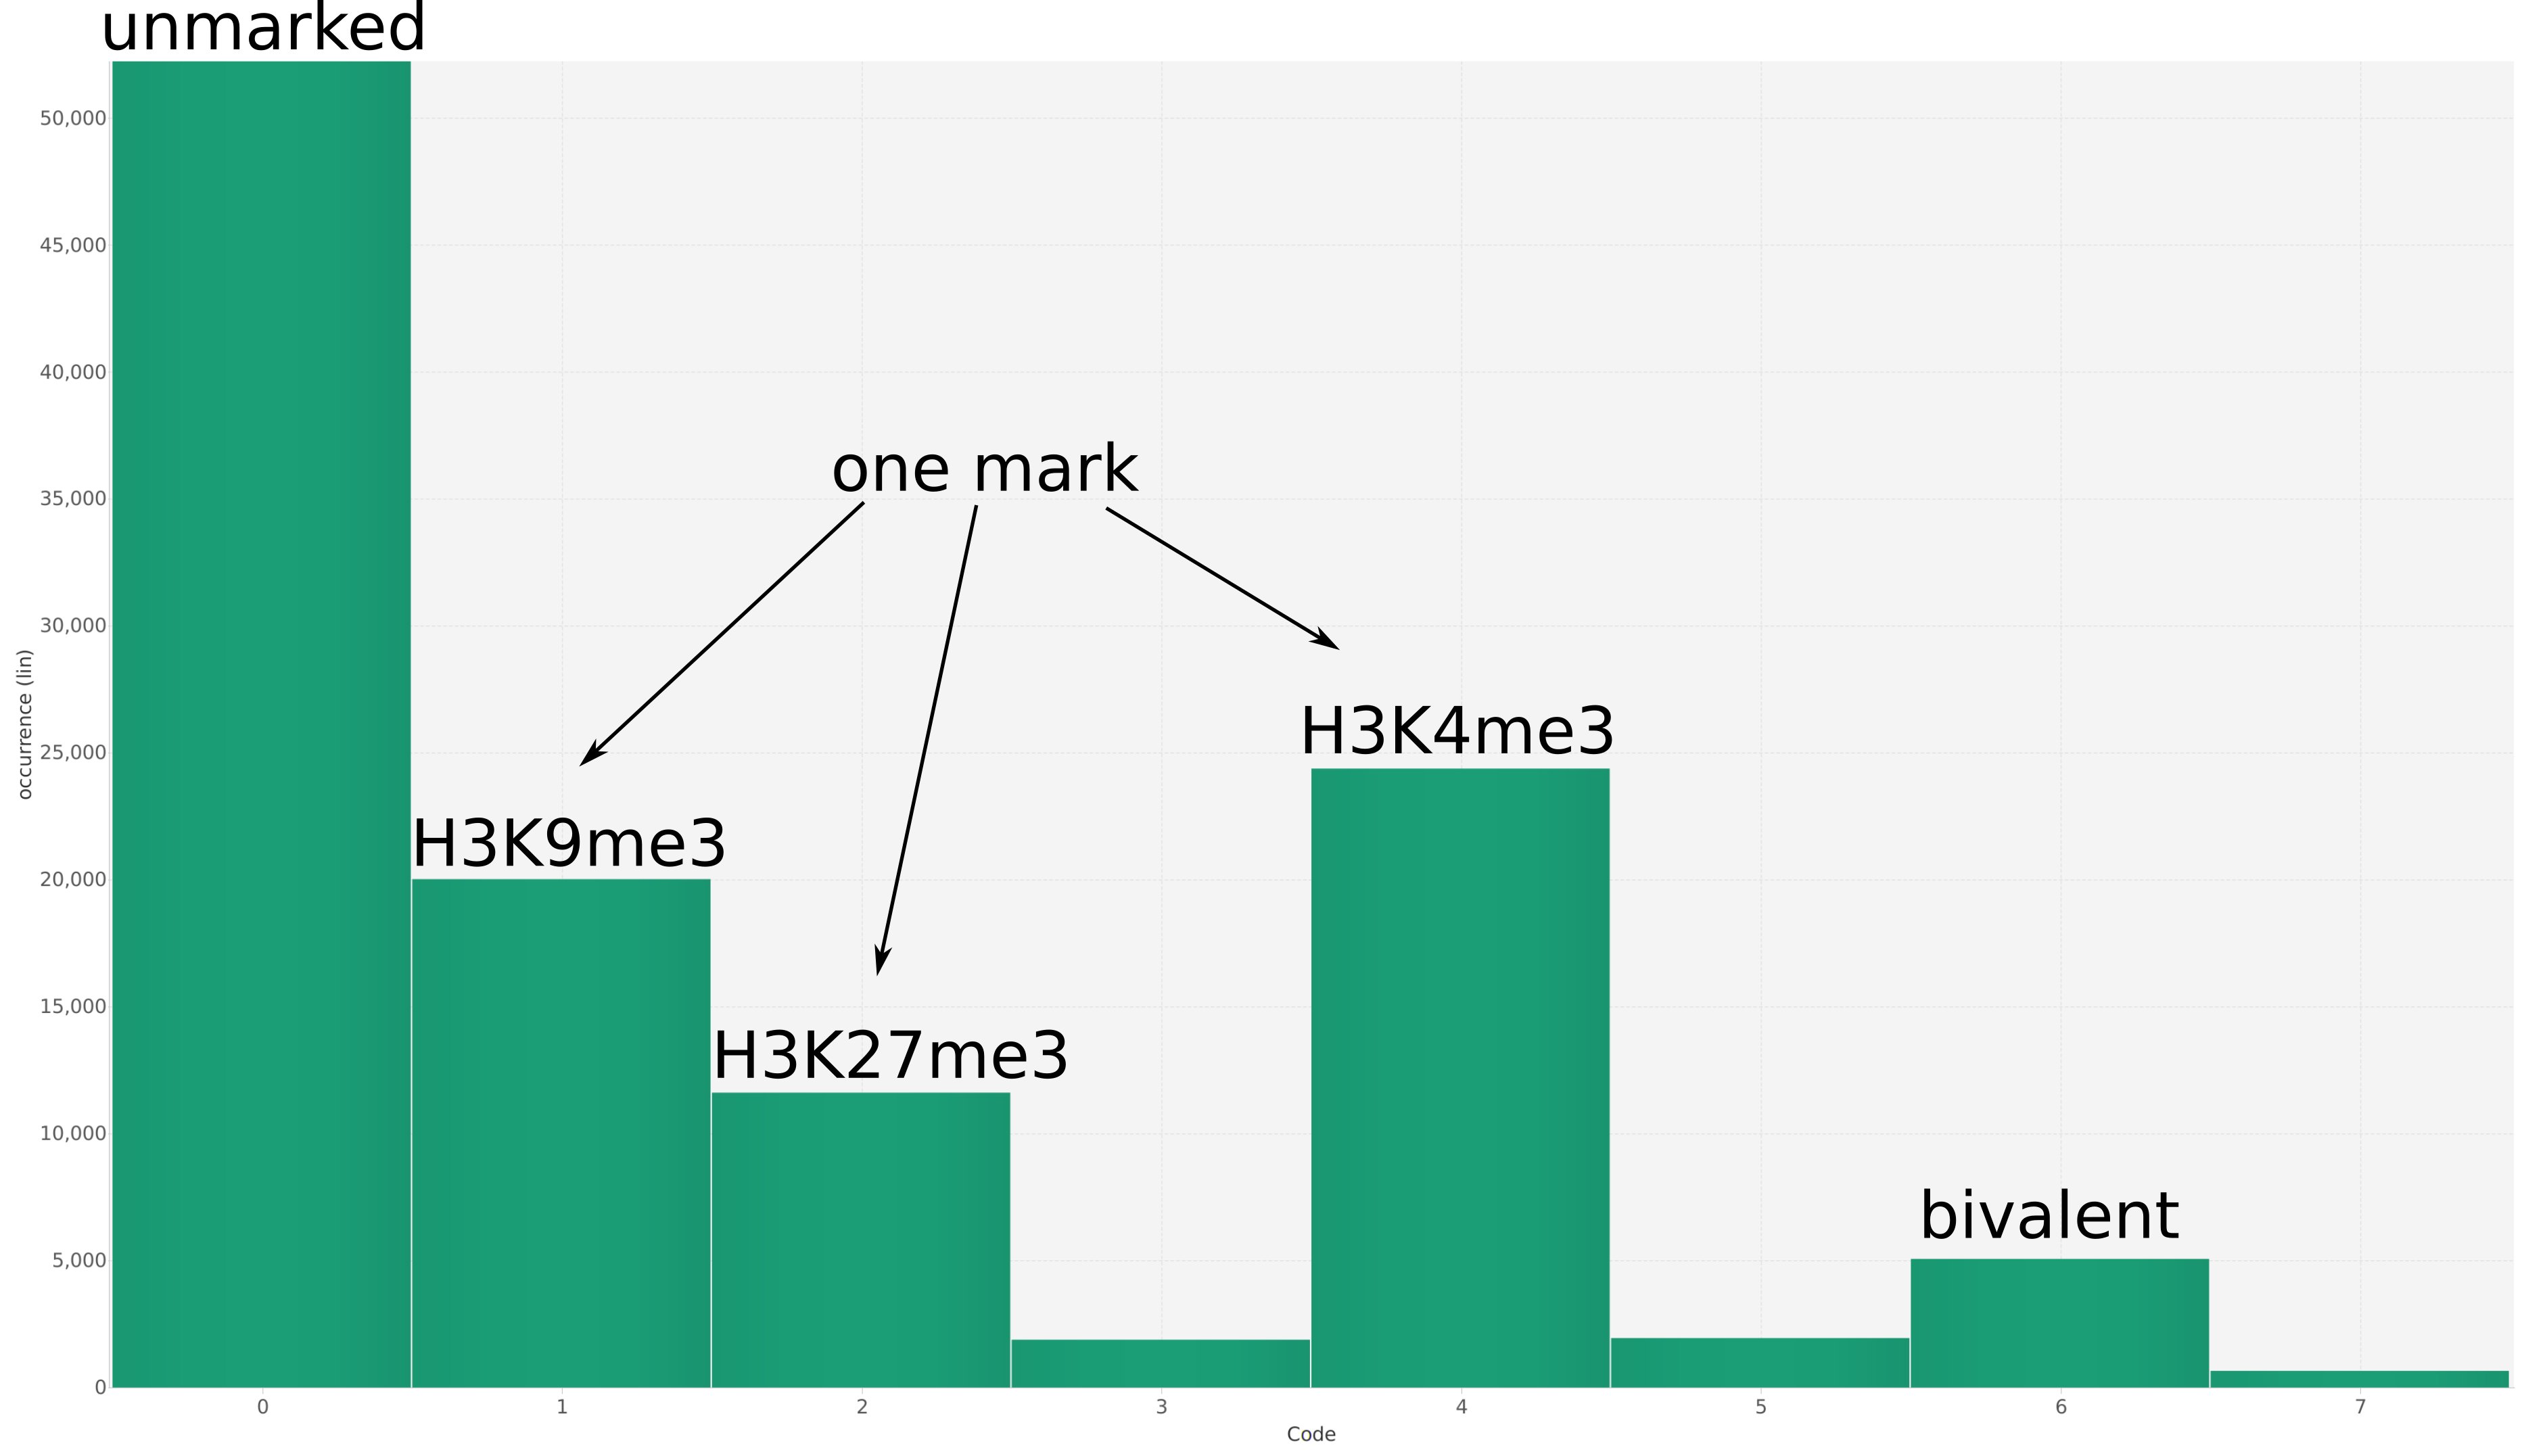
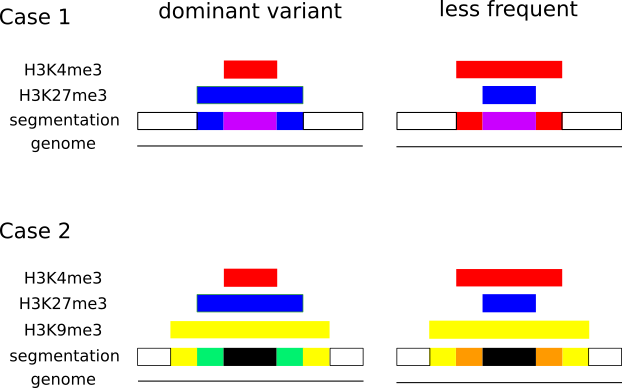
In epigenetics, the change of the combination of histone modifications at the same genomic location during cell differentiation is of great interest for understanding the function of these modifications and their combinations. Besides analyzing them locally for individual genomic locations or globally using correlations between different cells types, intermediate level analyses of these changes are of interest. More specifically, the different distributions of these combinations for different cell types, respectively, are compared to gain new insights.
Results and Discussion
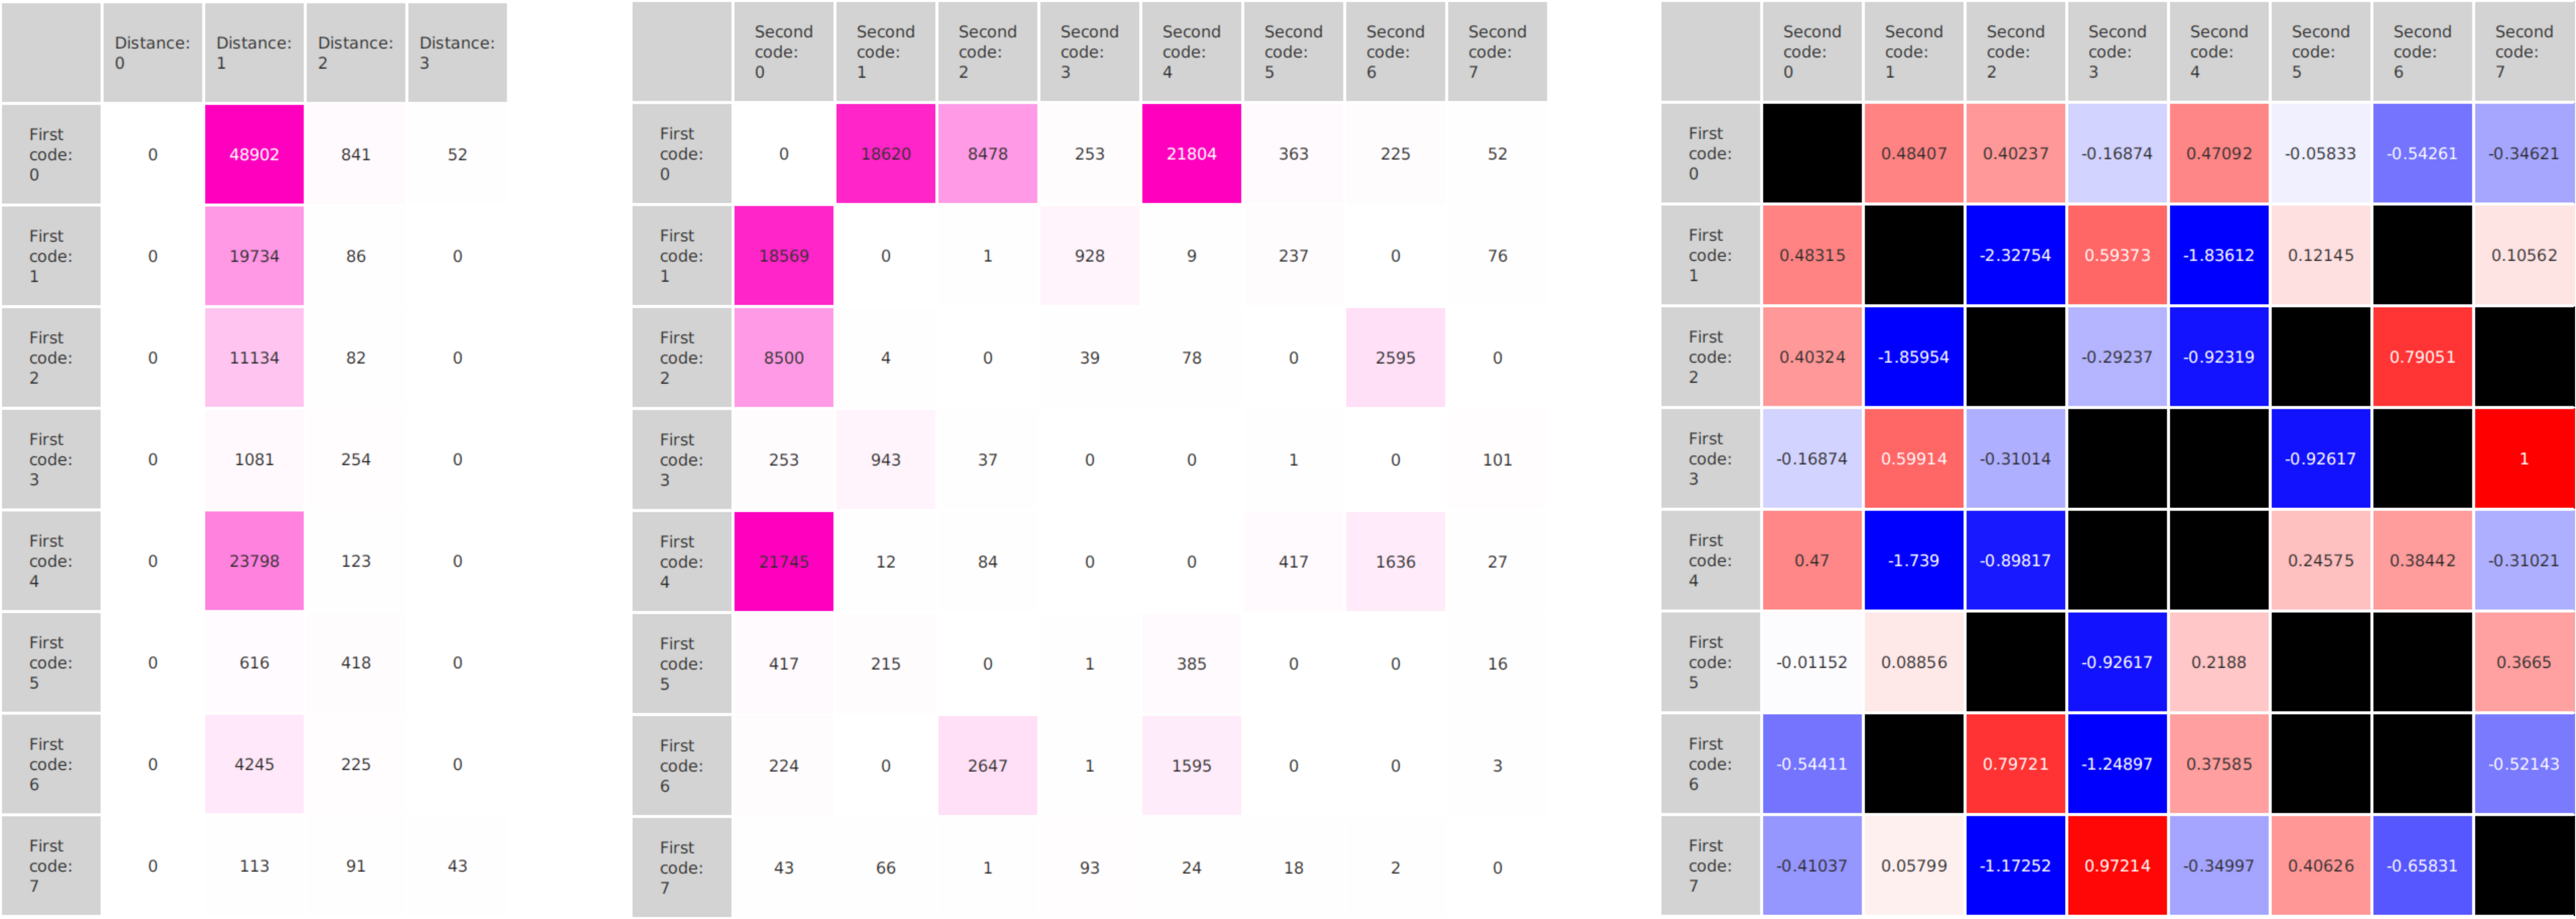
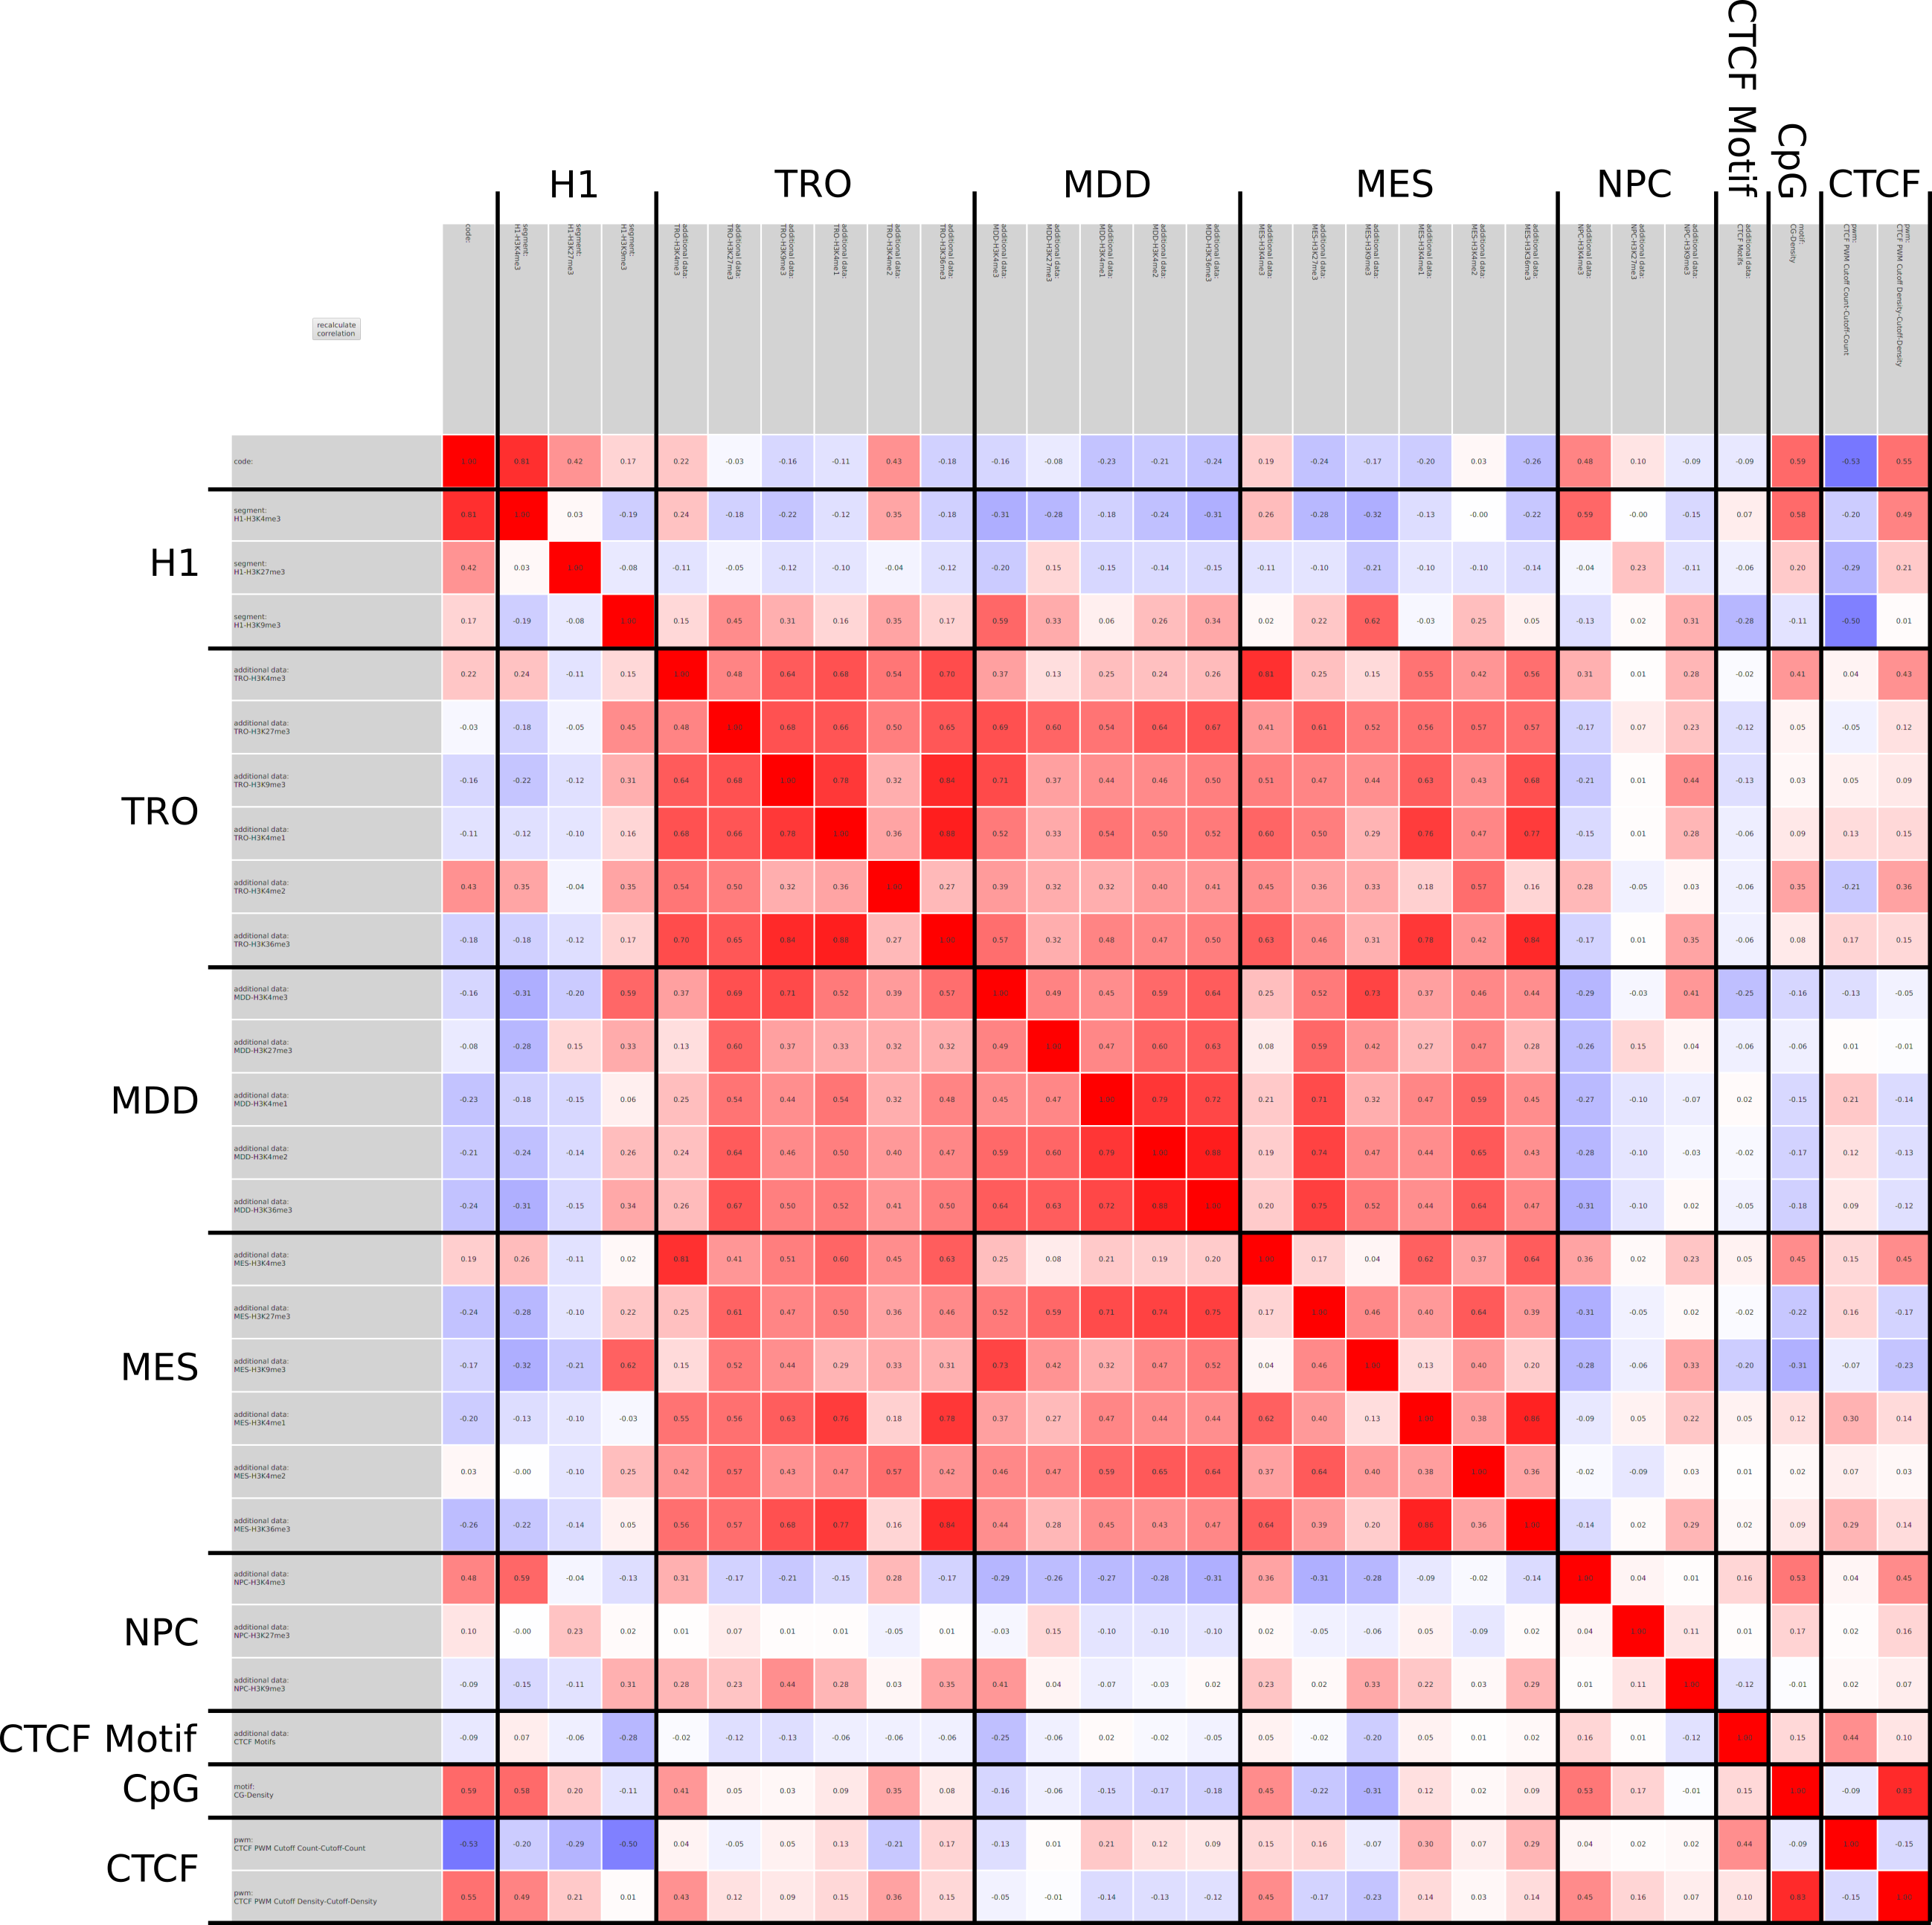
We propose a new tool called Masakari that allows segmenting genomes based on lists of ranges having a certain property, e.g., peaks describing histone modifications. It provides a graphical user interface allowing to select all data sets and setting all parameters needed for the segmentation process. Moreover, the graphical user interface provides statistical graphics allowing to assess the quality and suitability of the segmentation and the selected data.
Conclusion
Masakari provides statistics based visualizations and thus fosters insights into the combination of histone modification marks on genome ranges, and the differences of the distribution of these combinations between different cell types.