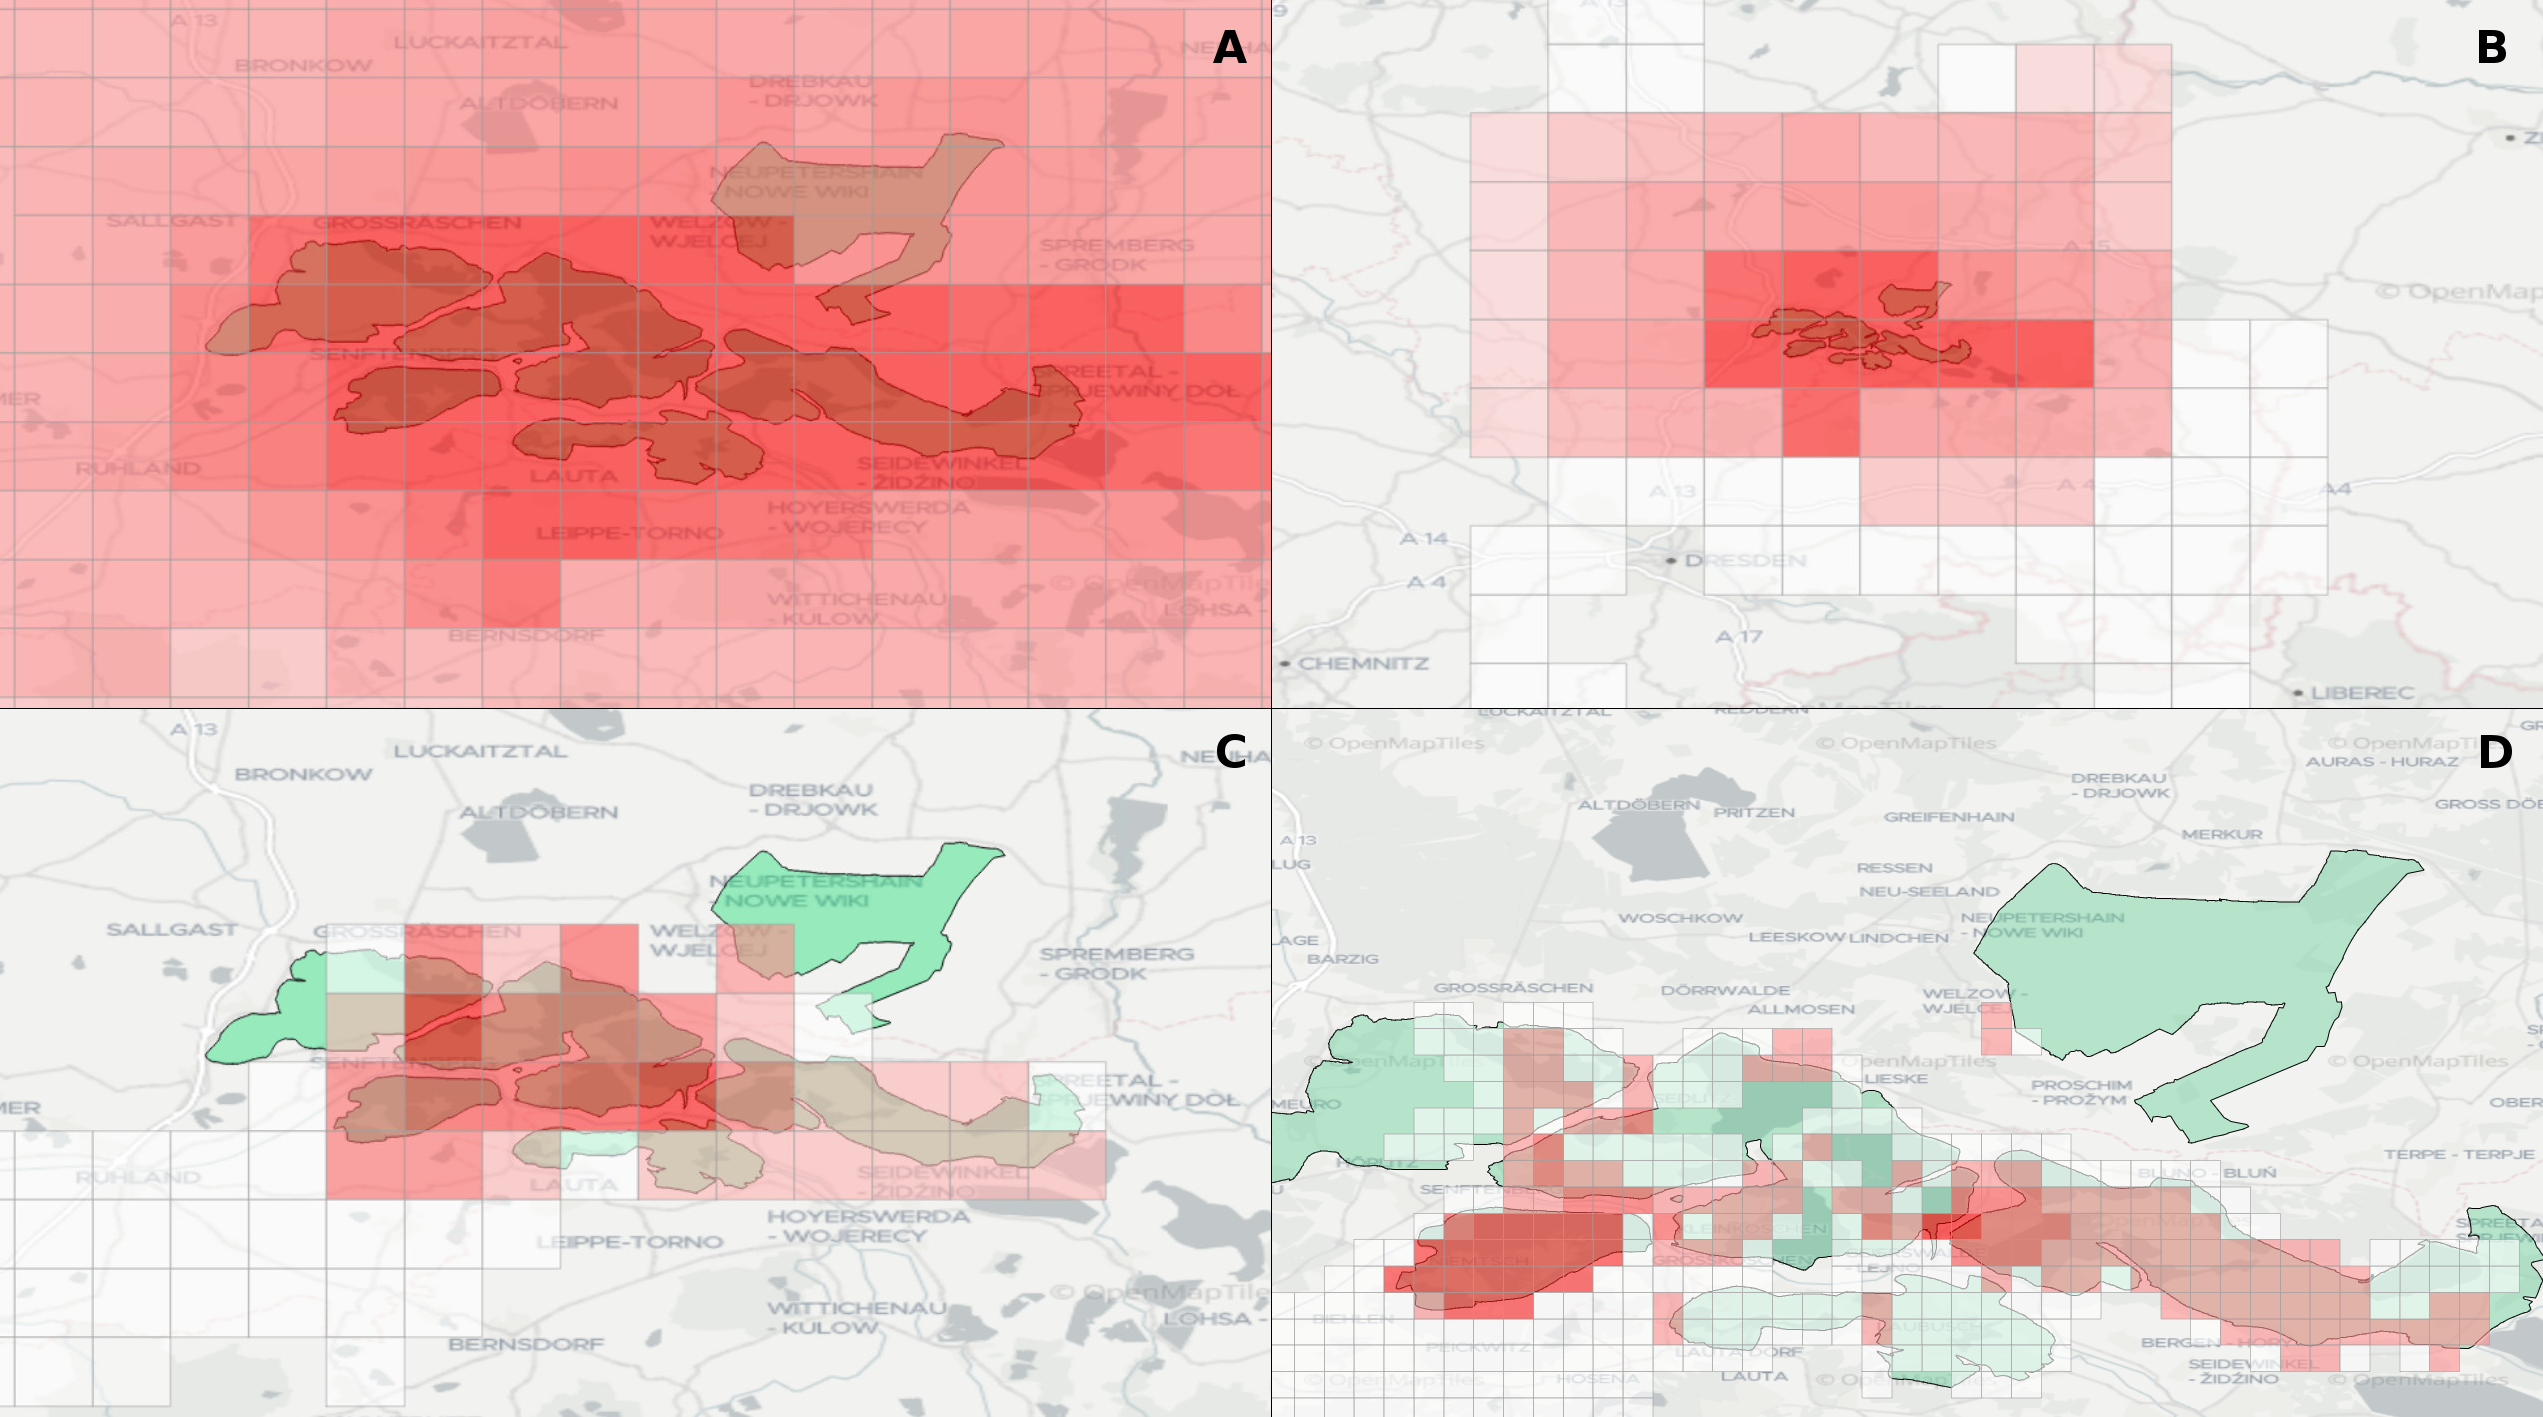
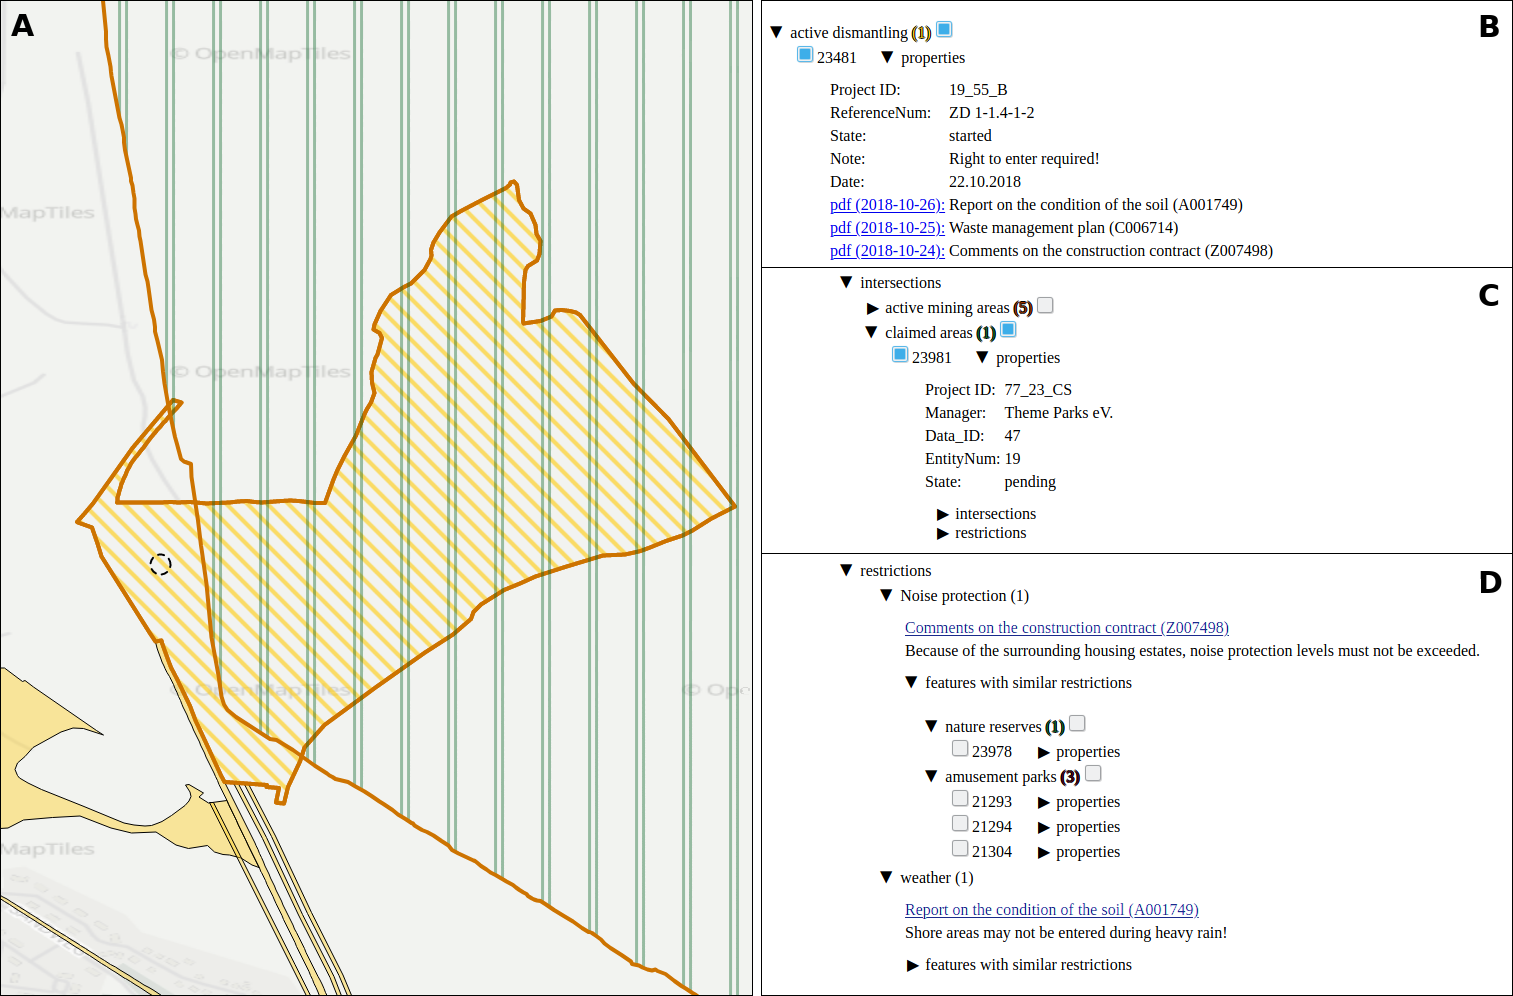
Experts face the task to decide where and how land reuse---transforming previously used areas into landscape and utility areas---can be performed. This decision is based on which area should be used, which restrictions exist, and which conditions have to be fulfilled for reusing this area. Information about the restrictions and the conditions is available as mostly textual, non-spatial data associated to areas overlapping the target areas. Due to the large amount of possible combinations of restrictions and conditions overlapping (partially) the target area, this decision process becomes quite tedious and cumbersome. Moreover, it proved to be useful to identify similar regions that have reached different stages of development within the data set which in turn allows determining common tasks for these regions. We support the experts in accomplishing these tasks by providing aggregated representations as well as multi-coordinated views together with category filters and selection mechanisms implemented in an interactive decision support system. Textual information is linked to these visualizations enabling the experts to justify their decisions. Evaluating our approach using a standard SUS questionnaire suggests, that especially the experts were very satisfied with the interactive decision support system.
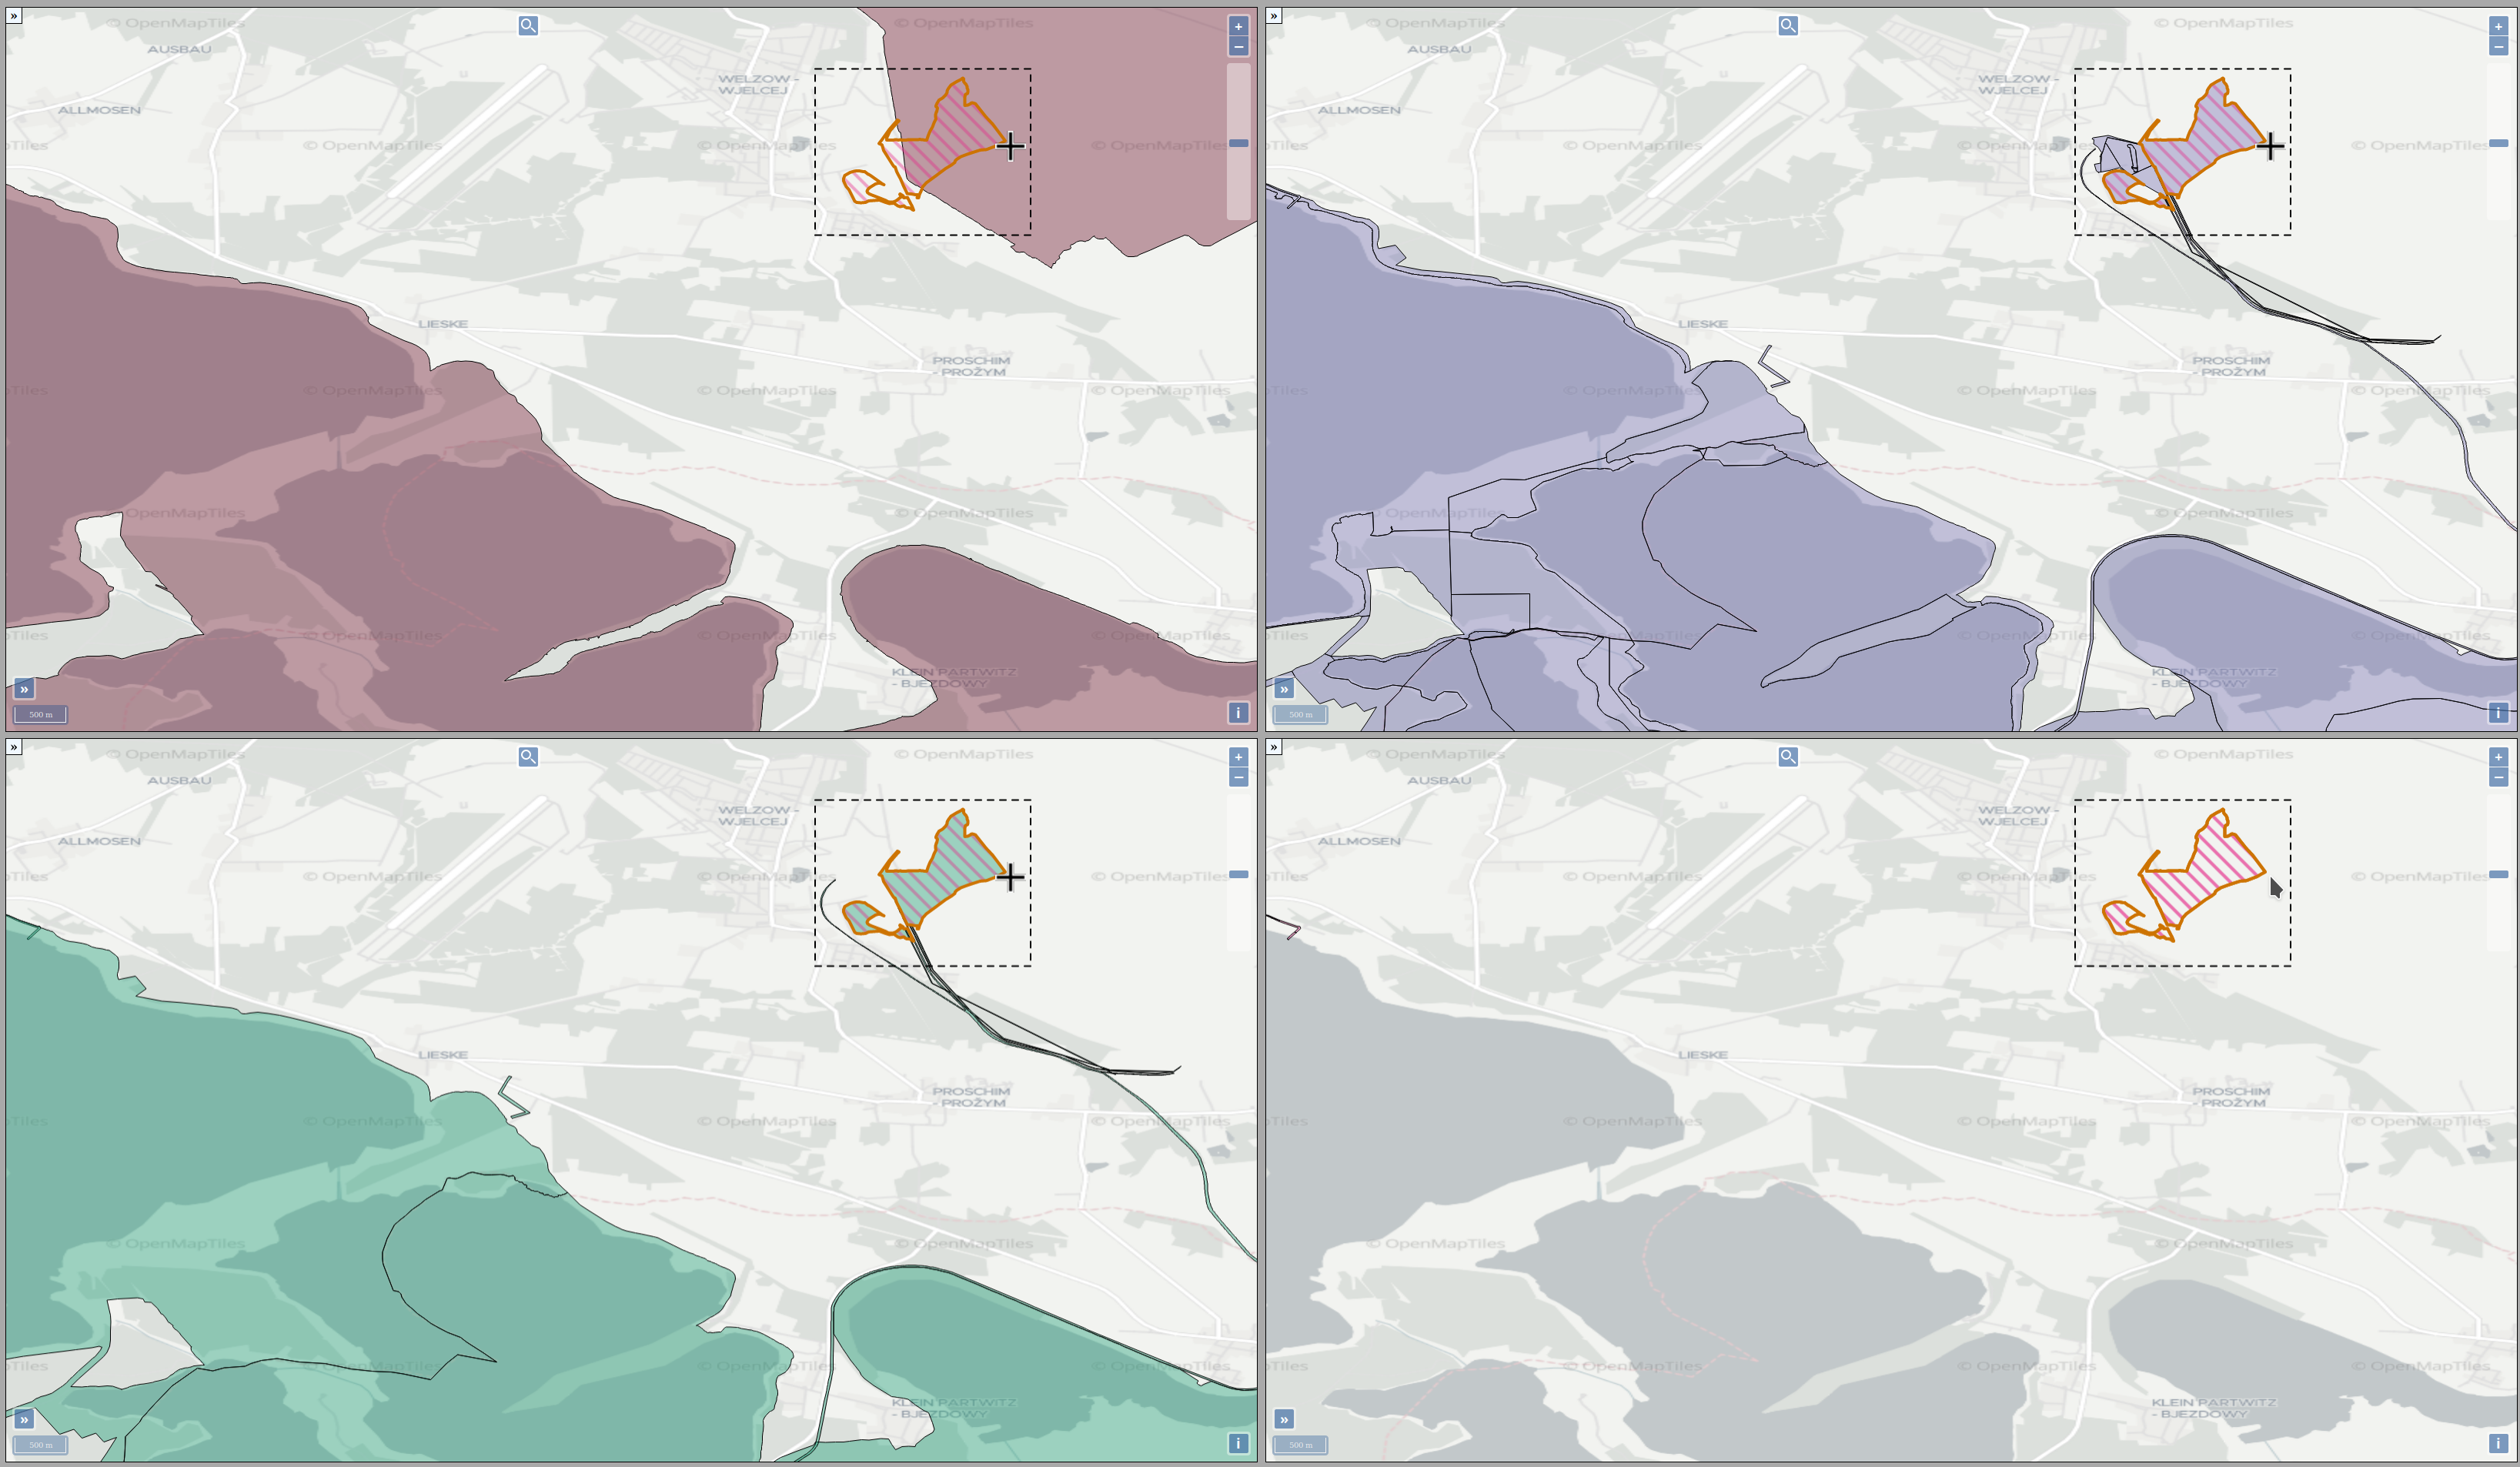
Land Reuse processes are large planning and decision-making processes based on a large amount of geographic data. Therefore, it is essential that this data is as accurate as possible. However, errors can occur during the creation of the data and not all of them are directly noticeable. We report here what errors we have encountered while working with this geographic data, what problems they can cause, and how we have fixed them. Since the correction can be very time-consuming with the enormous amount of data, we have focused on an automatic correction. Not all of this data can be corrected this way, for the rest, we briefly indicate a procedure to support and simplify the manual correction.


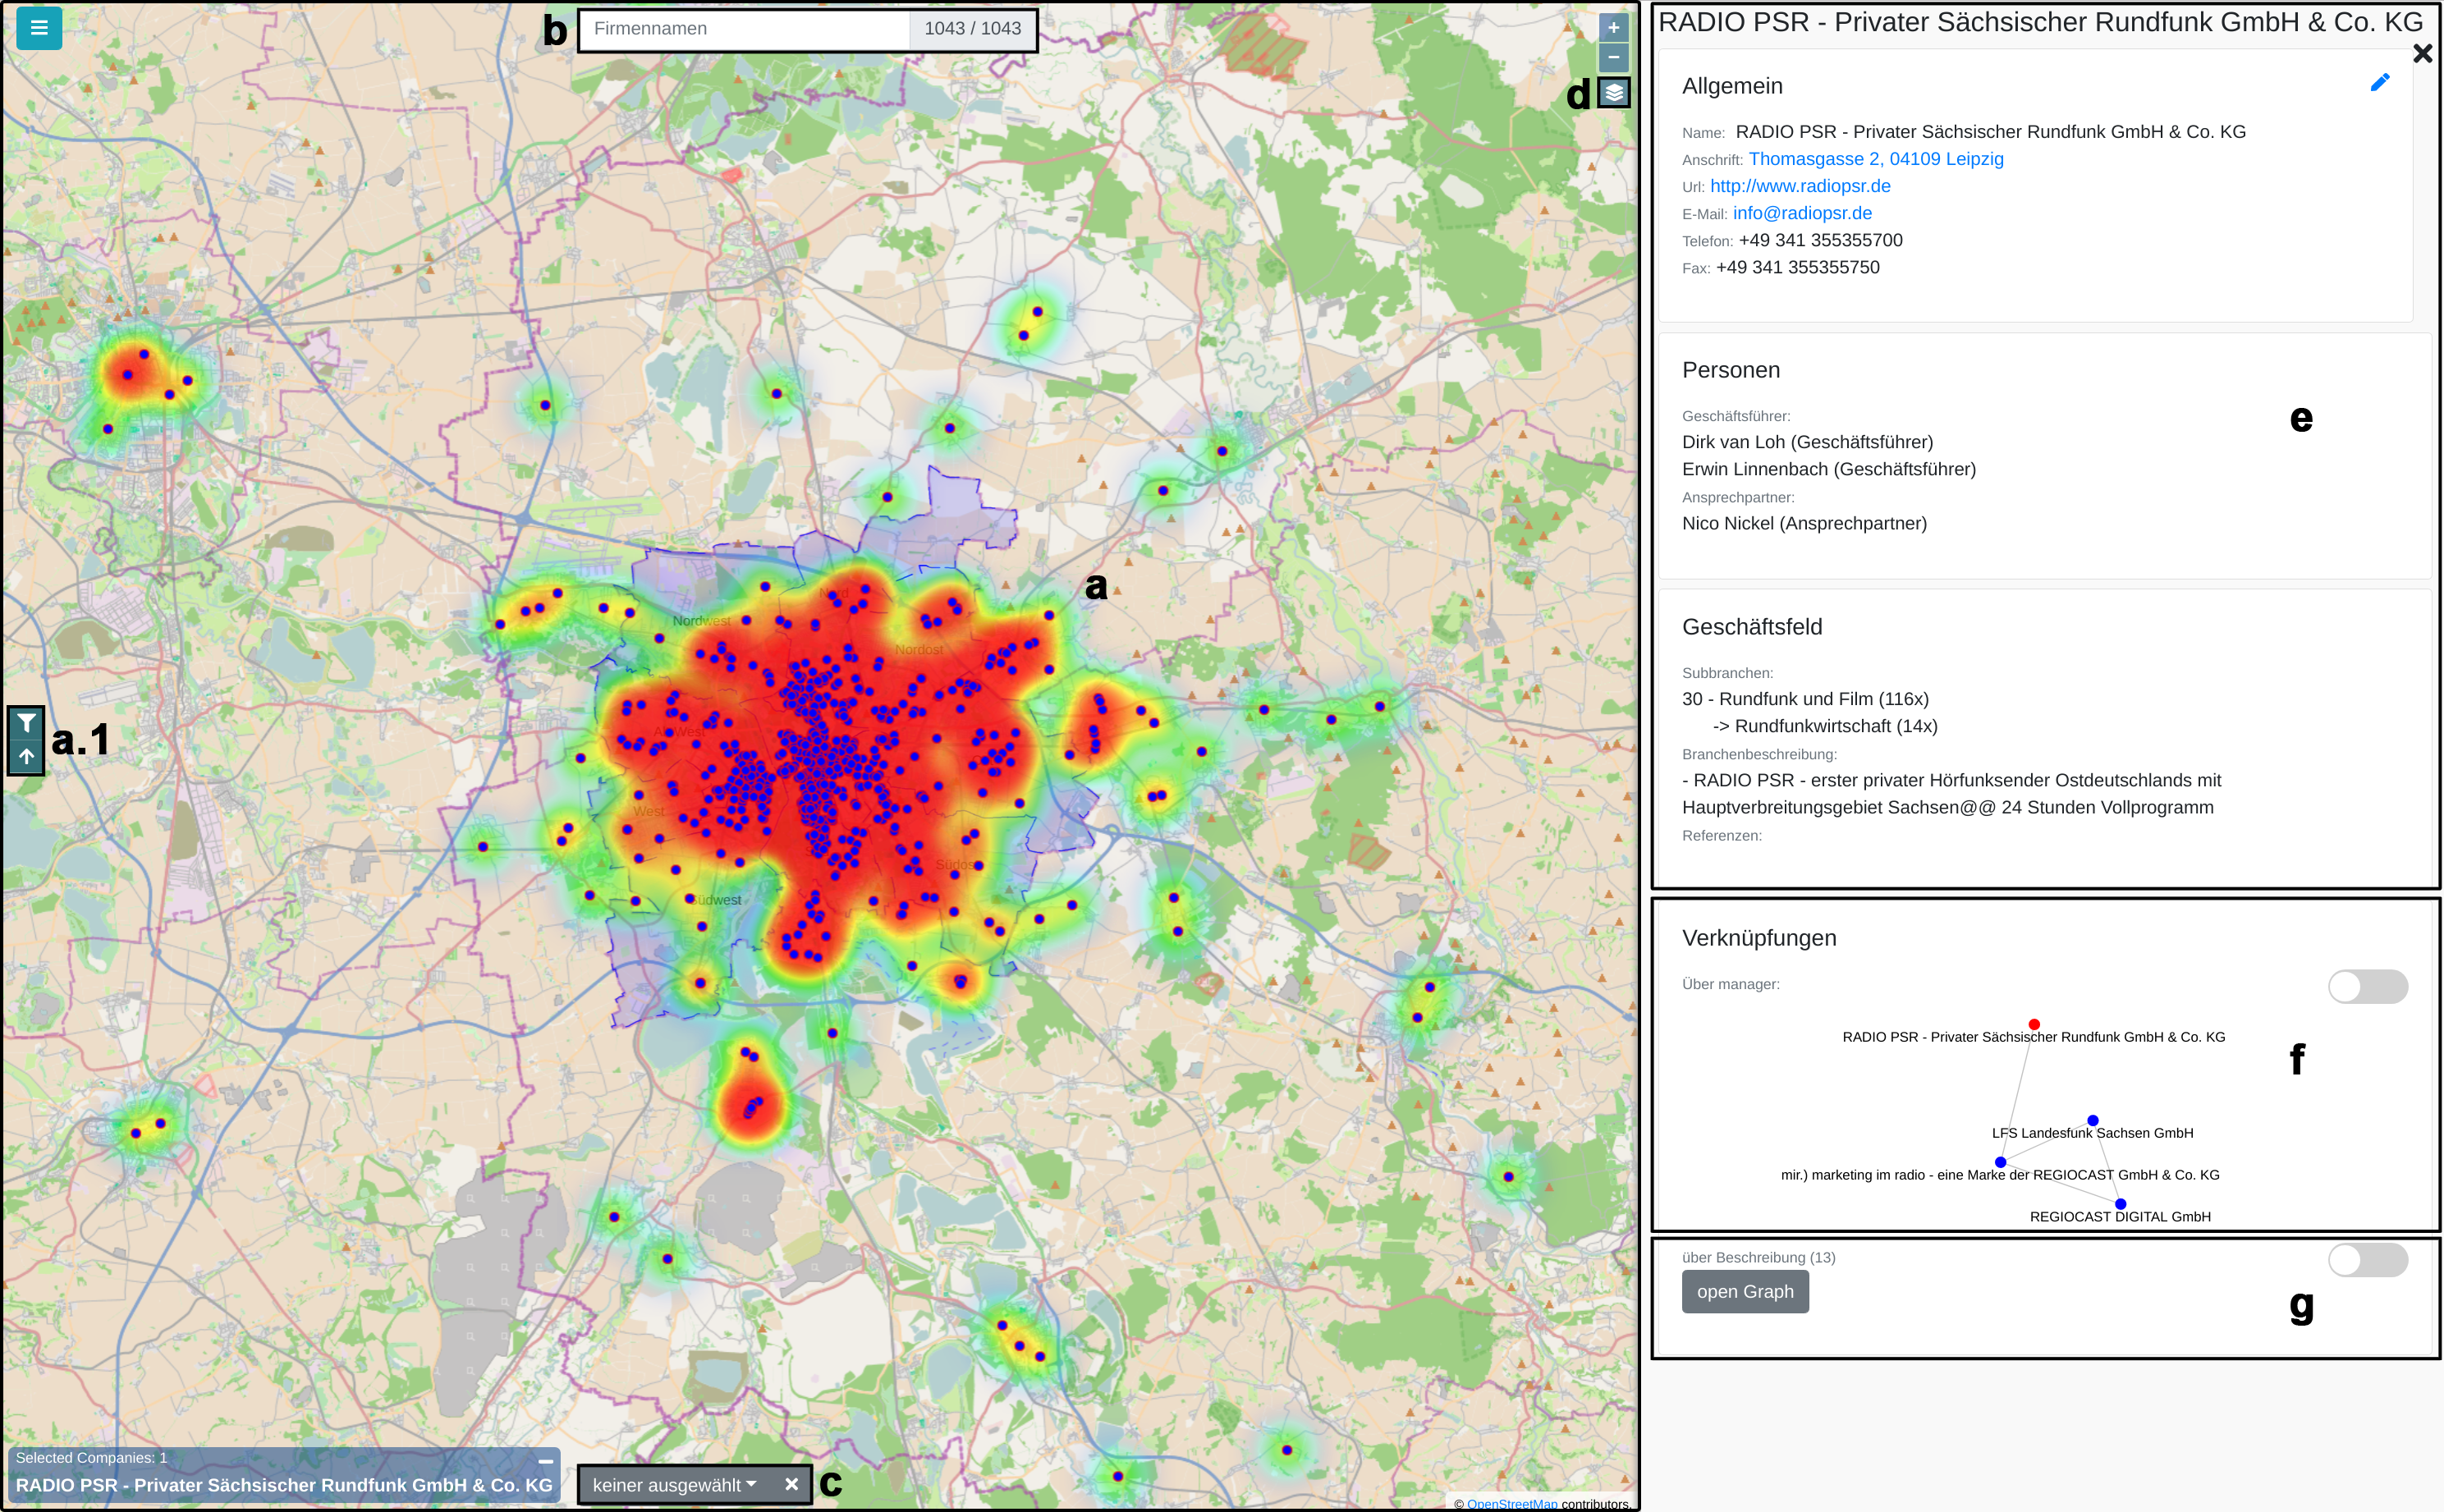
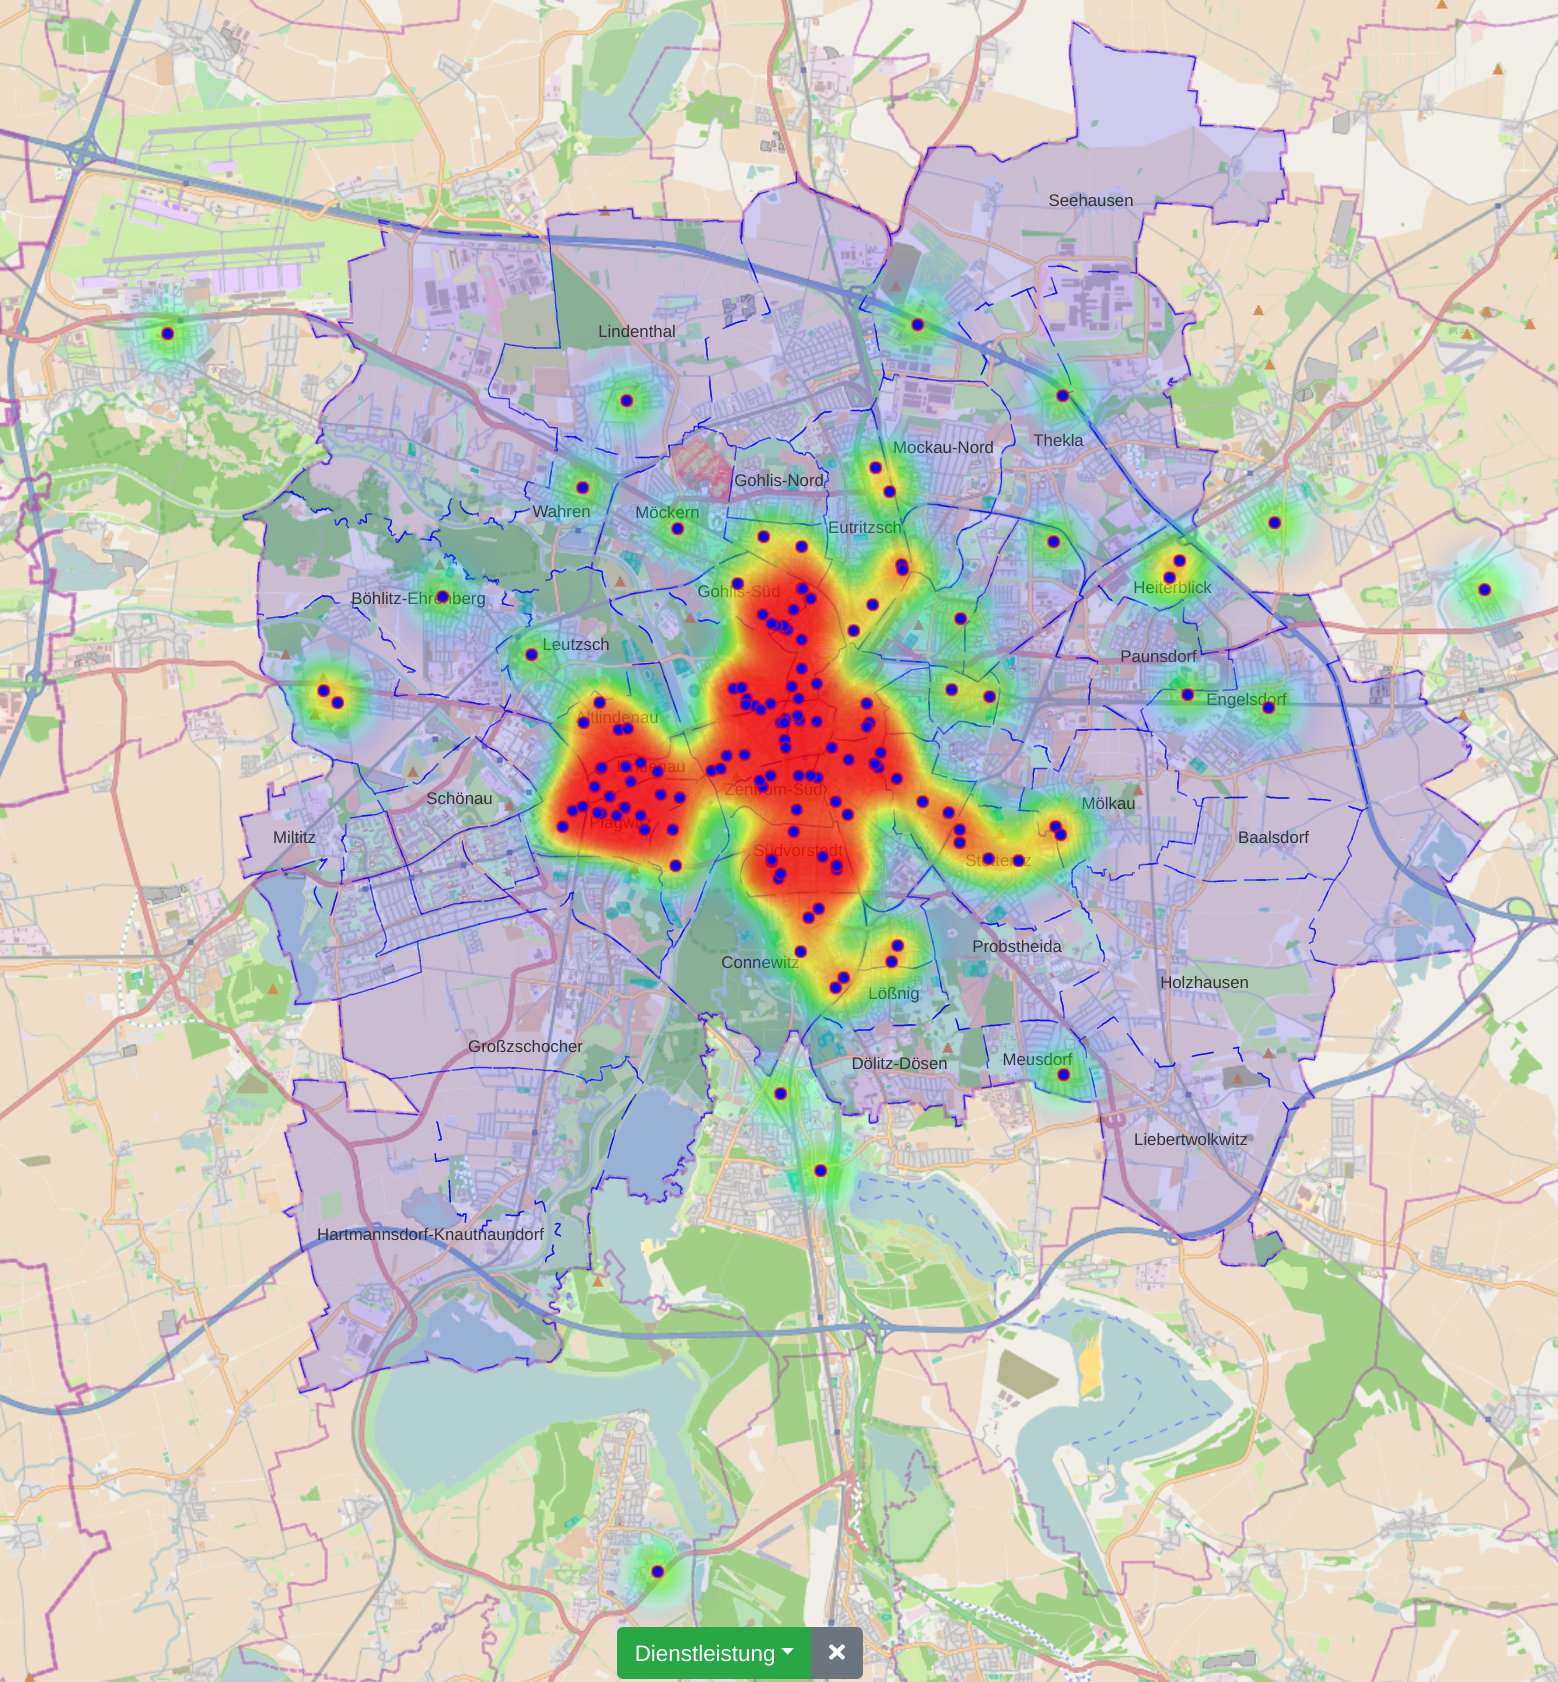
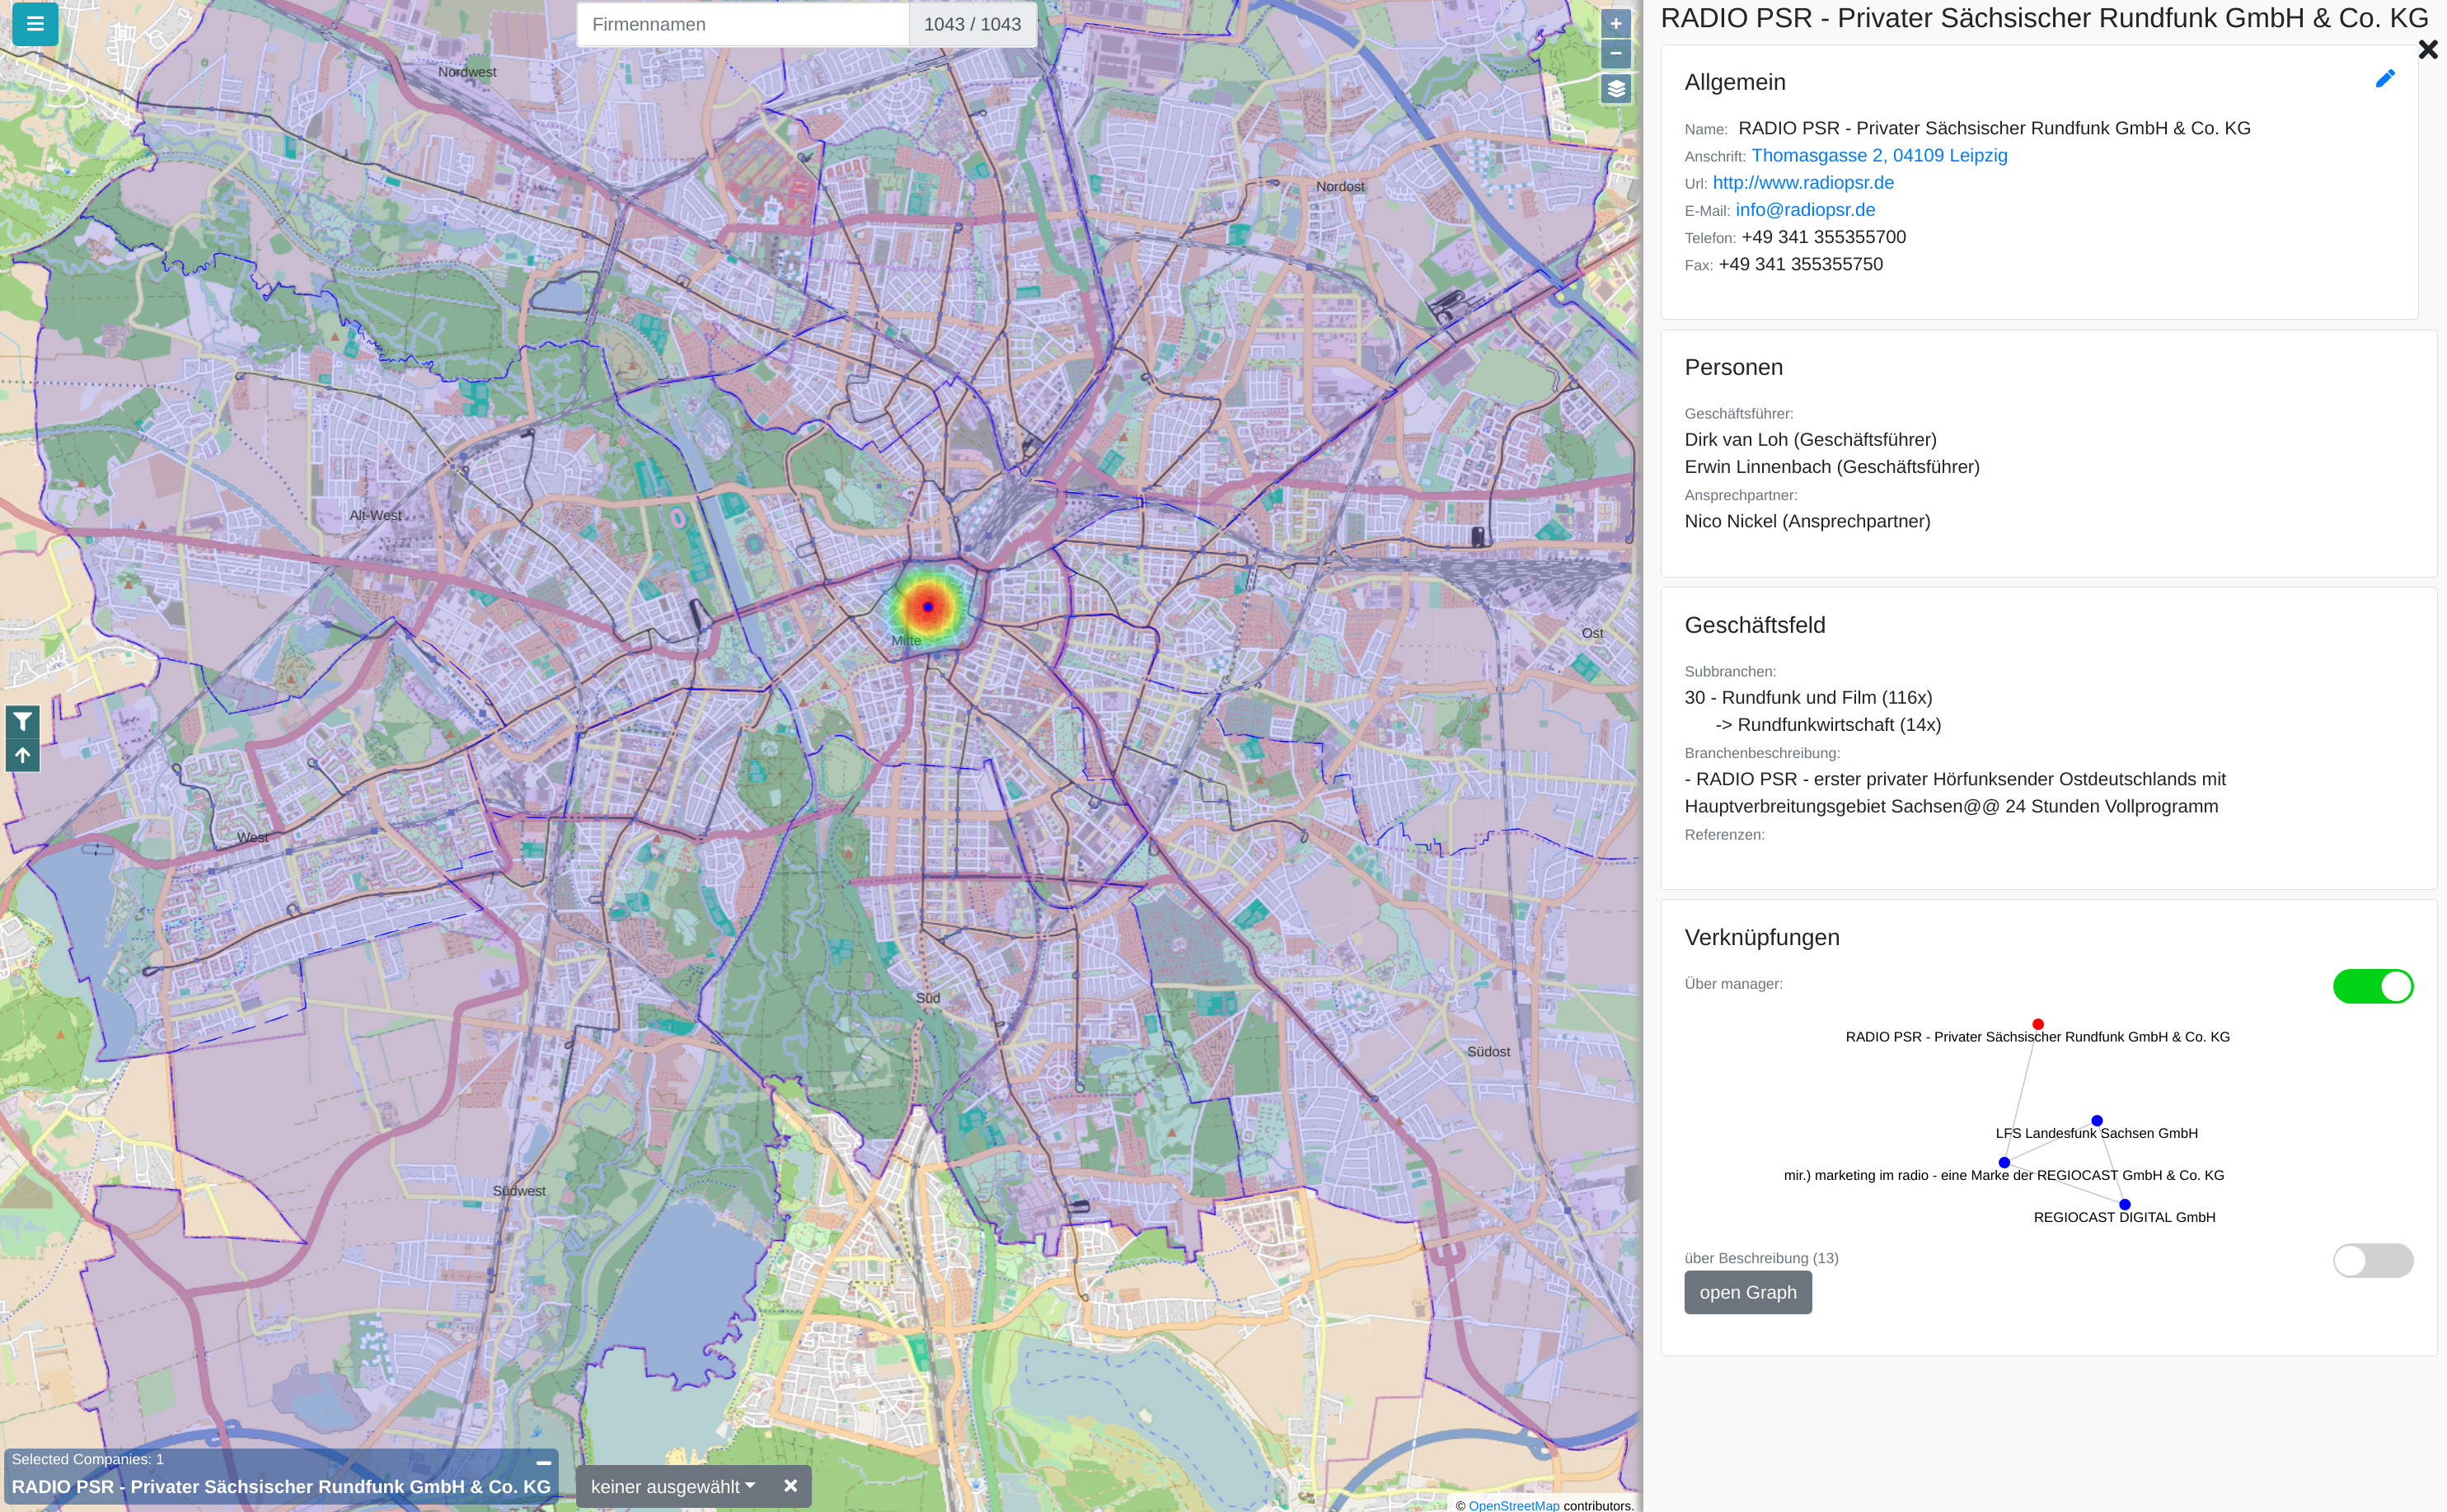
Municipal authorities have, among other tasks, a great interest in supporting their local economy. For this purpose, they provide consulting offices that advise companies and mediate cooperation partners.
The city administration of Leipzig created a business register in which companies can provide their competences in free text fields. This business register contains over 1000 entries and it is not straight forward to find and compare companies based on their self-descriptions.
In this paper, we propose a new visualization to analyze the distribution of local companies and exploring the competence profiles of the companies. In order to visualize connections between companies, we perform a semantical analysis. In detail, we use the management staff listing and the core competence descriptions to link the entries. The company location and the connections between the companies are visualized on a map or as a graph. The visualization provides several filtering and interaction mechanisms on demand. From a governance perspective, this leads to insights into company and industry sector networks within a local economic zone.