Background
In epigenetics, the change of the combination of histone modifications at the same genomic location during cell differentiation is of great interest for understanding the function of these modifications and their combinations. Besides analyzing them locally for individual genomic locations or globally using correlations between different cells types, intermediate level analyses of these changes are of interest. More specifically, the different distributions of these combinations for different cell types, respectively, are compared to gain new insights.
Results and Discussion
We propose a new tool called Masakari that allows segmenting genomes based on lists of ranges having a certain property, e.g., peaks describing histone modifications. It provides a graphical user interface allowing to select all data sets and setting all parameters needed for the segmentation process. Moreover, the graphical user interface provides statistical graphics allowing to assess the quality and suitability of the segmentation and the selected data.
Conclusion
Masakari provides statistics based visualizations and thus fosters insights into the combination of histone modification marks on genome ranges, and the differences of the distribution of these combinations between different cell types.


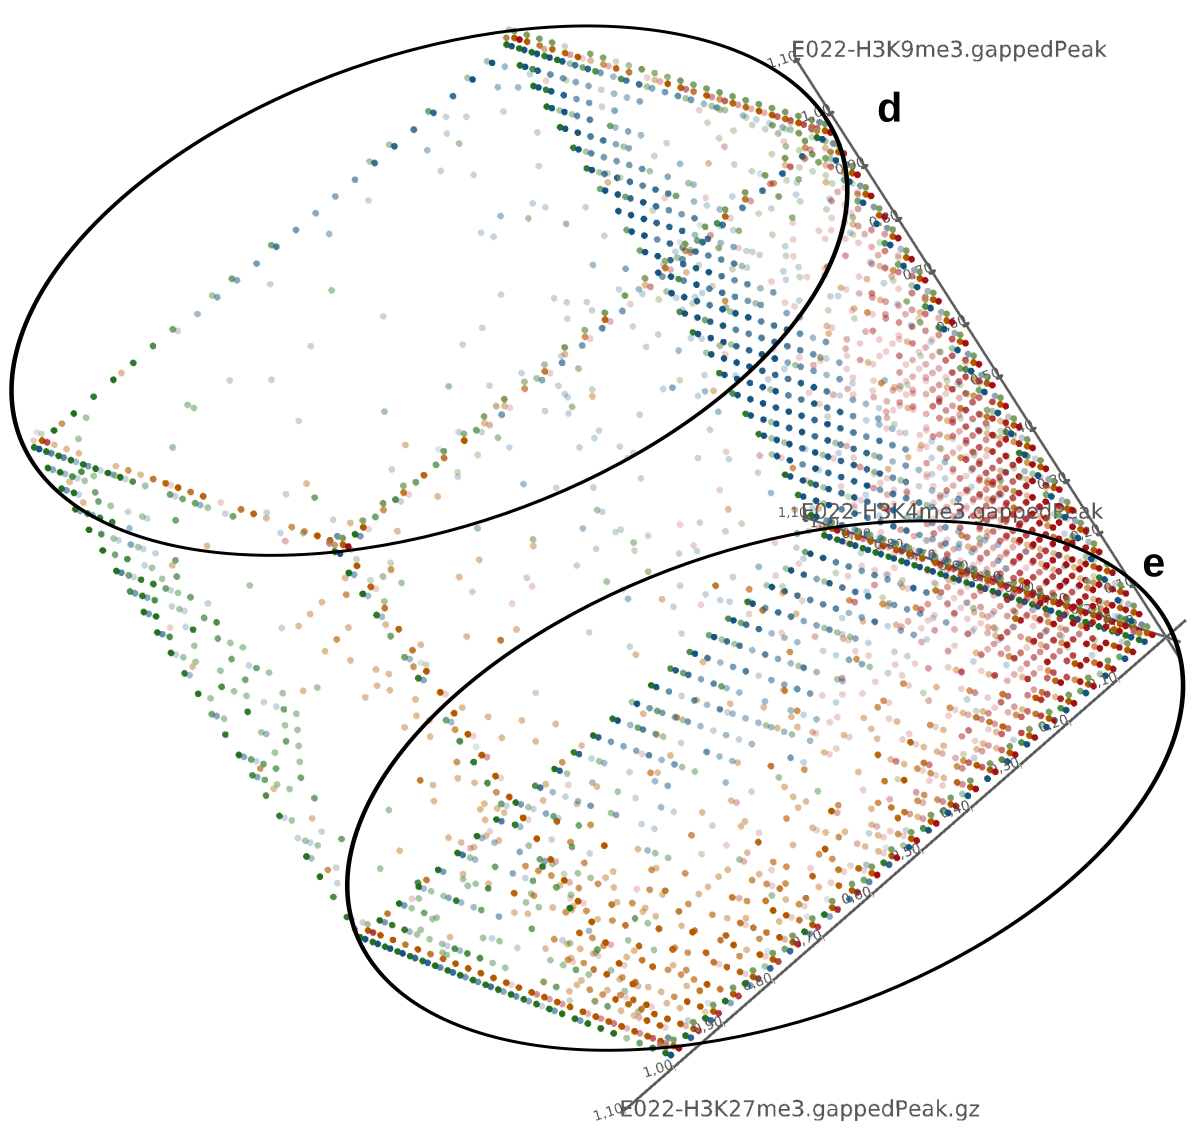
A major goal in epigenetics is understanding how cells differentiate into different cell types. Besides the increase of individual data sets, the amount of replicated experiments generating a tremendous amount of data is ever increasing. While biologists primarily analyze their data on the highest level using statistical correlations or on the lowest level analyzing nucleotide sequences, determining the fate of histone modifications during cell specification necessitates improved analysis capabilities on one or more intermediate levels. For this type of analysis, it proved to be very useful to use tiled binned scatter plot matrices showing binary relationships or to use tiled binned 3D scatter plots showing ternary relationships. Quarternary or general n-ary relationships are not easily analyzable using visualization techniques like scatter plots, only. Therefore, we augmented existing clustering methods with the tiling and binning idea enabling the analysis of n-ary relationships. Analyzing the changes of histone modifications comparing two cell lines using tiled binned clustering, we found new, unknown relations in the data.
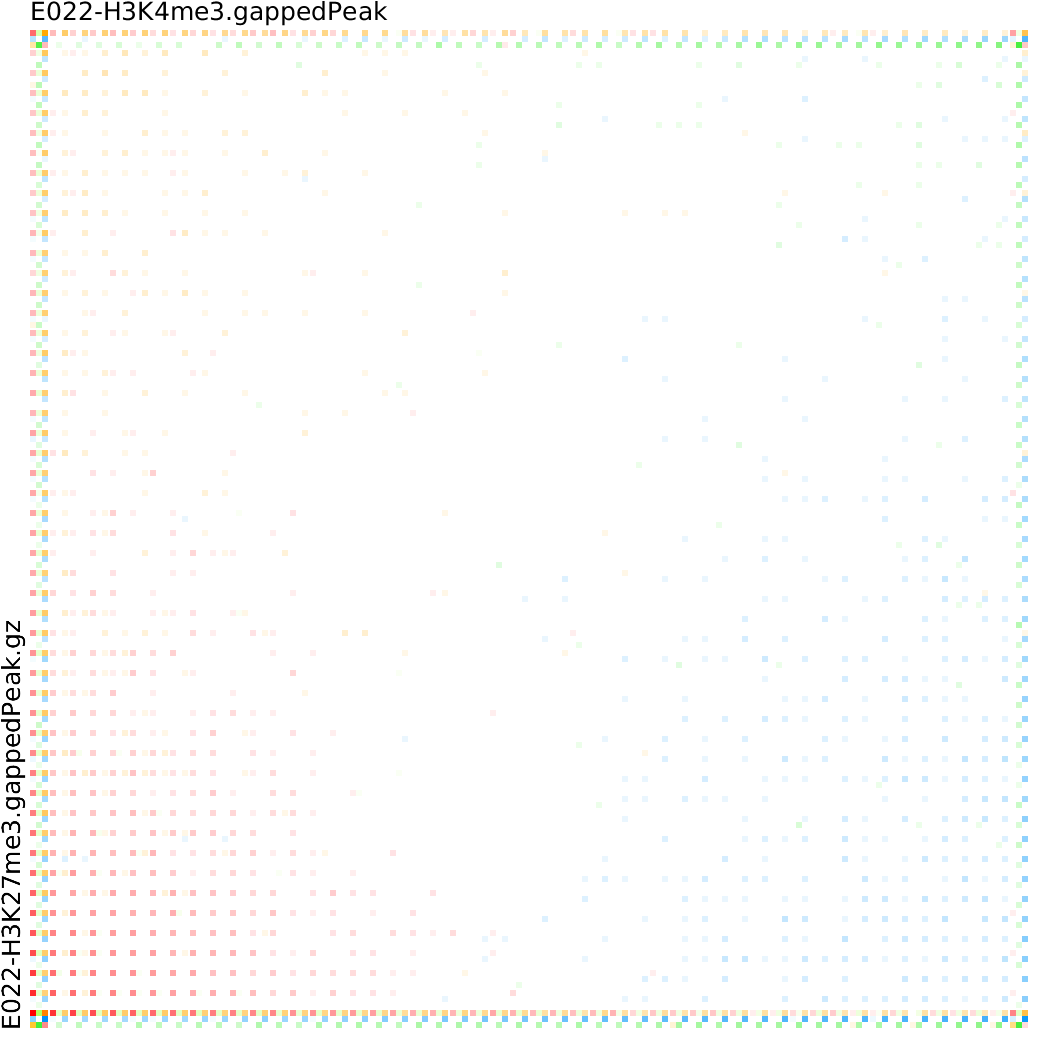
Epigenetics data is very important for understand- ing the differentiation of cells into different cell types. More- over, the amount of epigenetic data available was and still is considerably increasing. To cope with this big amount of data, statistical or visual analysis is used. Usually, biologists analyze epigenetic data using statistical methods like correlations on a high level. However, this does not allow to analyze the fate of histone modifications in detail during cell specification or to compare histone modifications in different cell lines. Tiled binned scatter plot matrices proved to be very useful for this type of analysis showing binary relationships. We adapted the idea of tiling and binning scatter plots from 2D to 3D, such that ternary relationships can be depicted. Comparing tiled binned 3D scatter plots—the new method—to tiled binned 2D scatter plot matrices showed, that many relations that are difficult or impossible to find using tiled binned 2D scatter plot matrices can easily be observed using the new approach. We found that using our approach, changes in the distribution of the marks over time (different cell types) or differences between different replicates of the same cell sample are easy to detect. Tiled binned 3D scatter plots proved superior compared to the previously used method due to the reduced amount of overplotting leading to less interaction necessary for gaining similar insights.
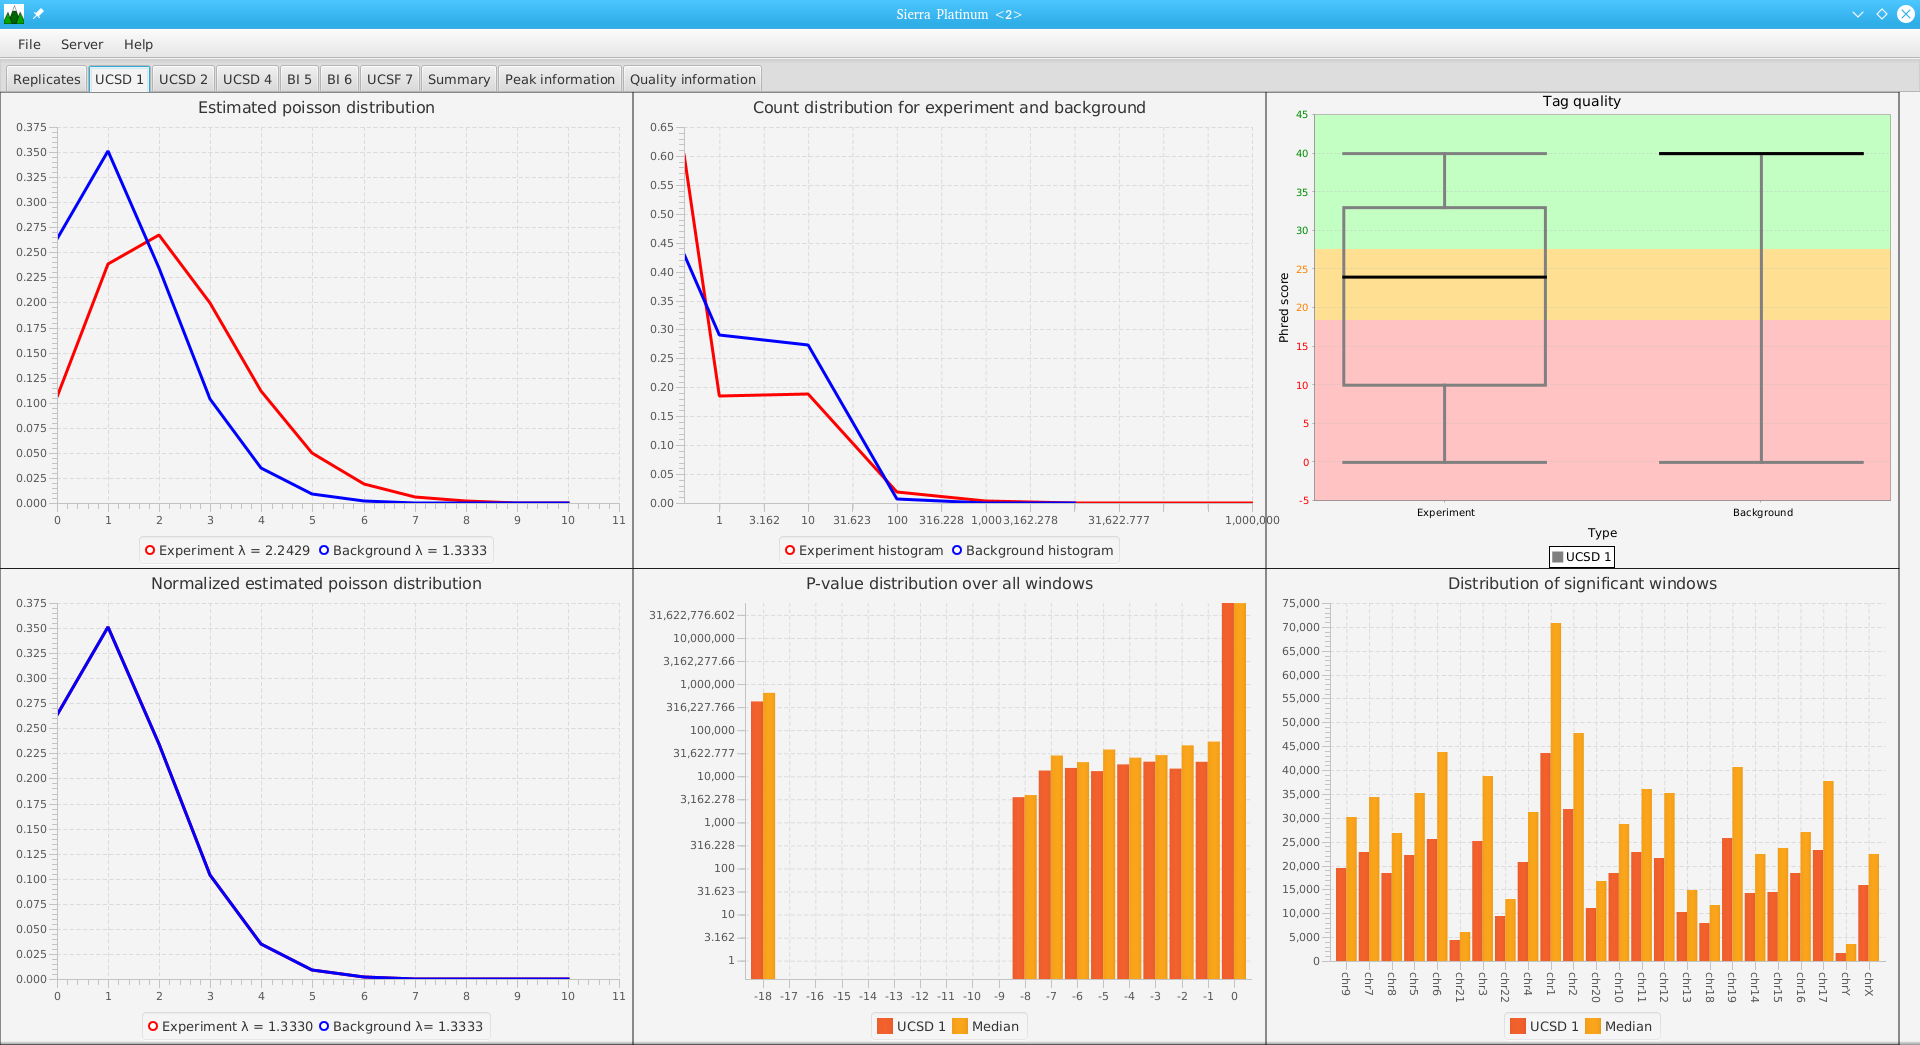
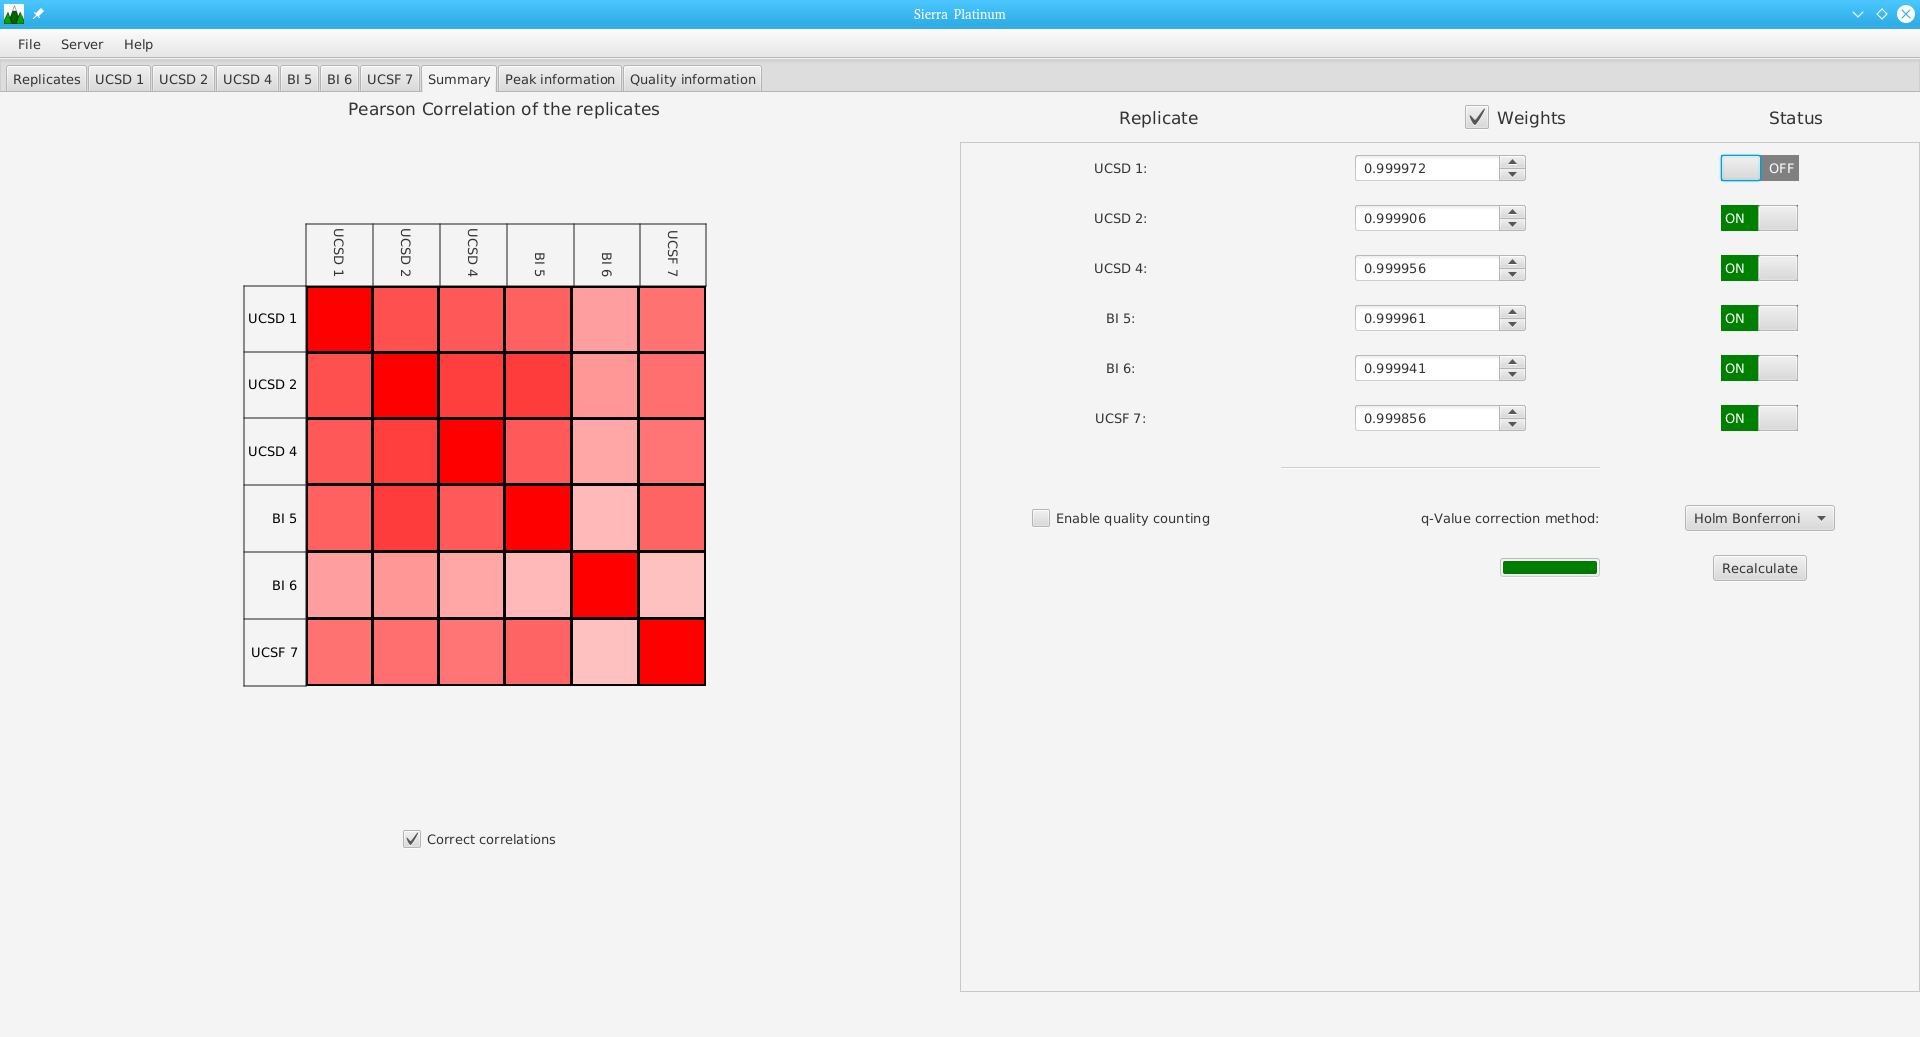
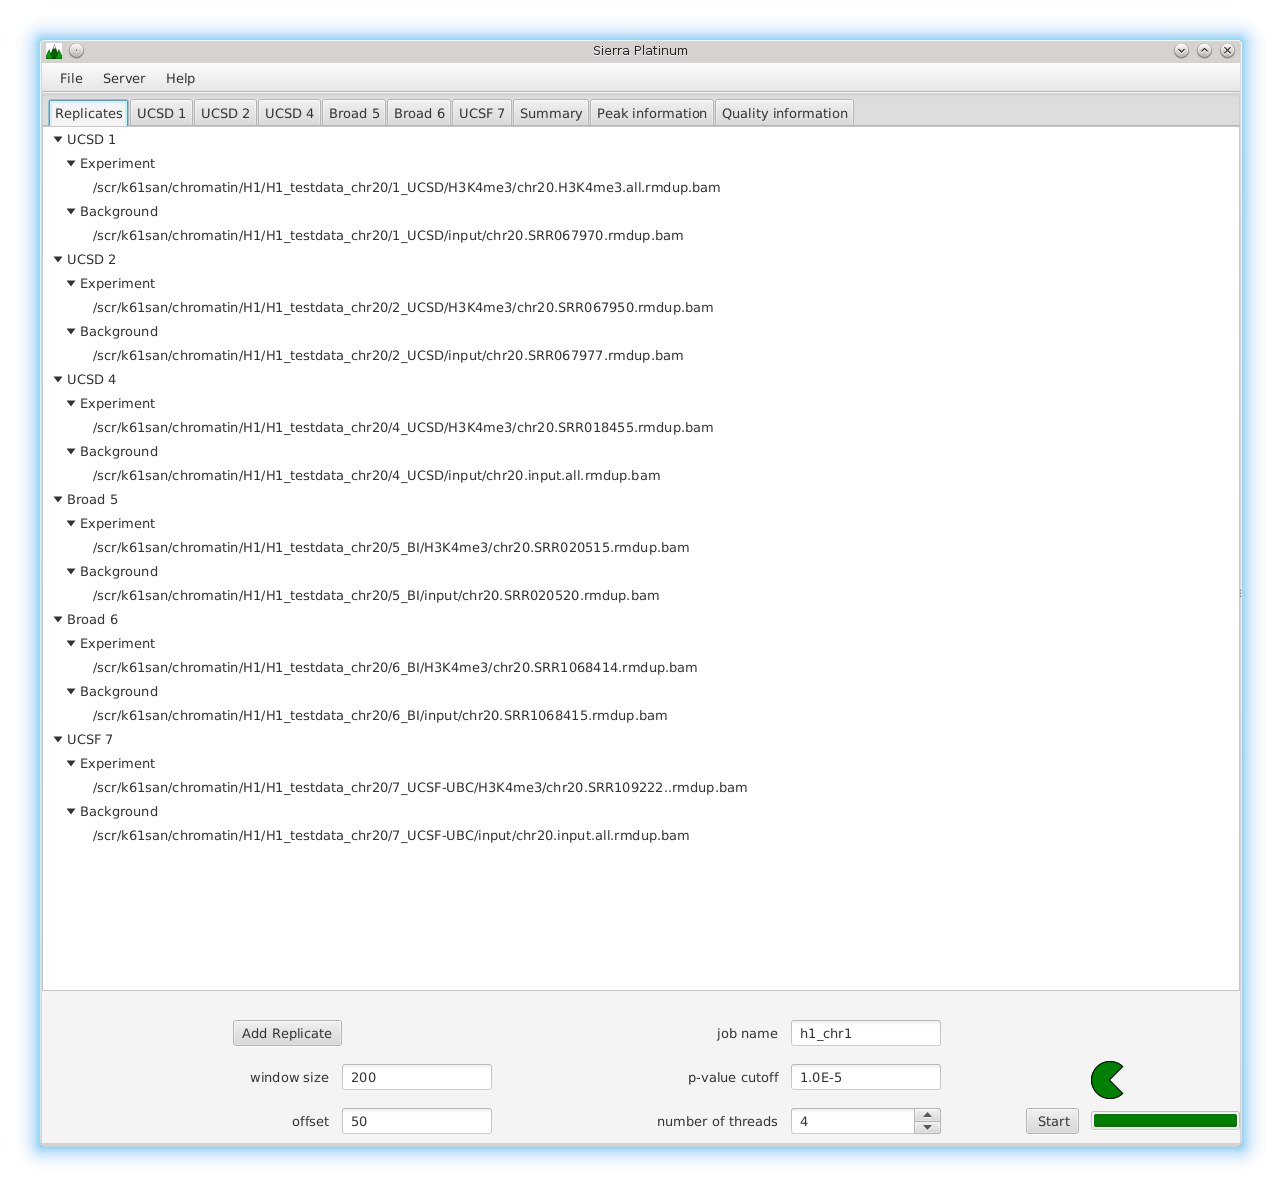
DNA bound proteins such as transcription factors and modified histone proteins play an important role in gene regulation. Therefore, their genomic locations are of great interest. Usually, the location is measured using ChIP-seq and analyzed using a peak-caller. While replicated ChIP-seq experiments become more and more available, they are still mostly analyzed using methods based on peak-callers for single replicates. The only exception is PePr, which allows peak calling of several replicates. However, PePr does not provide quality measures to assess the result of the peak-calling process. Moreover, its underlying model might not be suitable for the conditions under which the experiments are performed. We propose a new peak-caller called `Sierra Platinum' that not only allows to call peaks for several replicates but also provides a variety of quality measures. Together with integrated visualizations, the quality measures support the assessment of the replicates and the resulting peaks. We show that Sierra Platinum outperforms methods based on single-replicate peak-callers as well as PePr using a newly generated benchmark data set and using real data from the NIH Roadmap Epigenomics Project.
In the last two decades the study of changes in the genome function that are not induced by changes in DNA has consolidated a strong research field called ”epigenetics”. Chromatin state changes play an essential role in the regulation of transcription of many genes, thus controlling cell differentiation. A large part of these changes is due to histone modifications that alter the accessibility of the DNA.
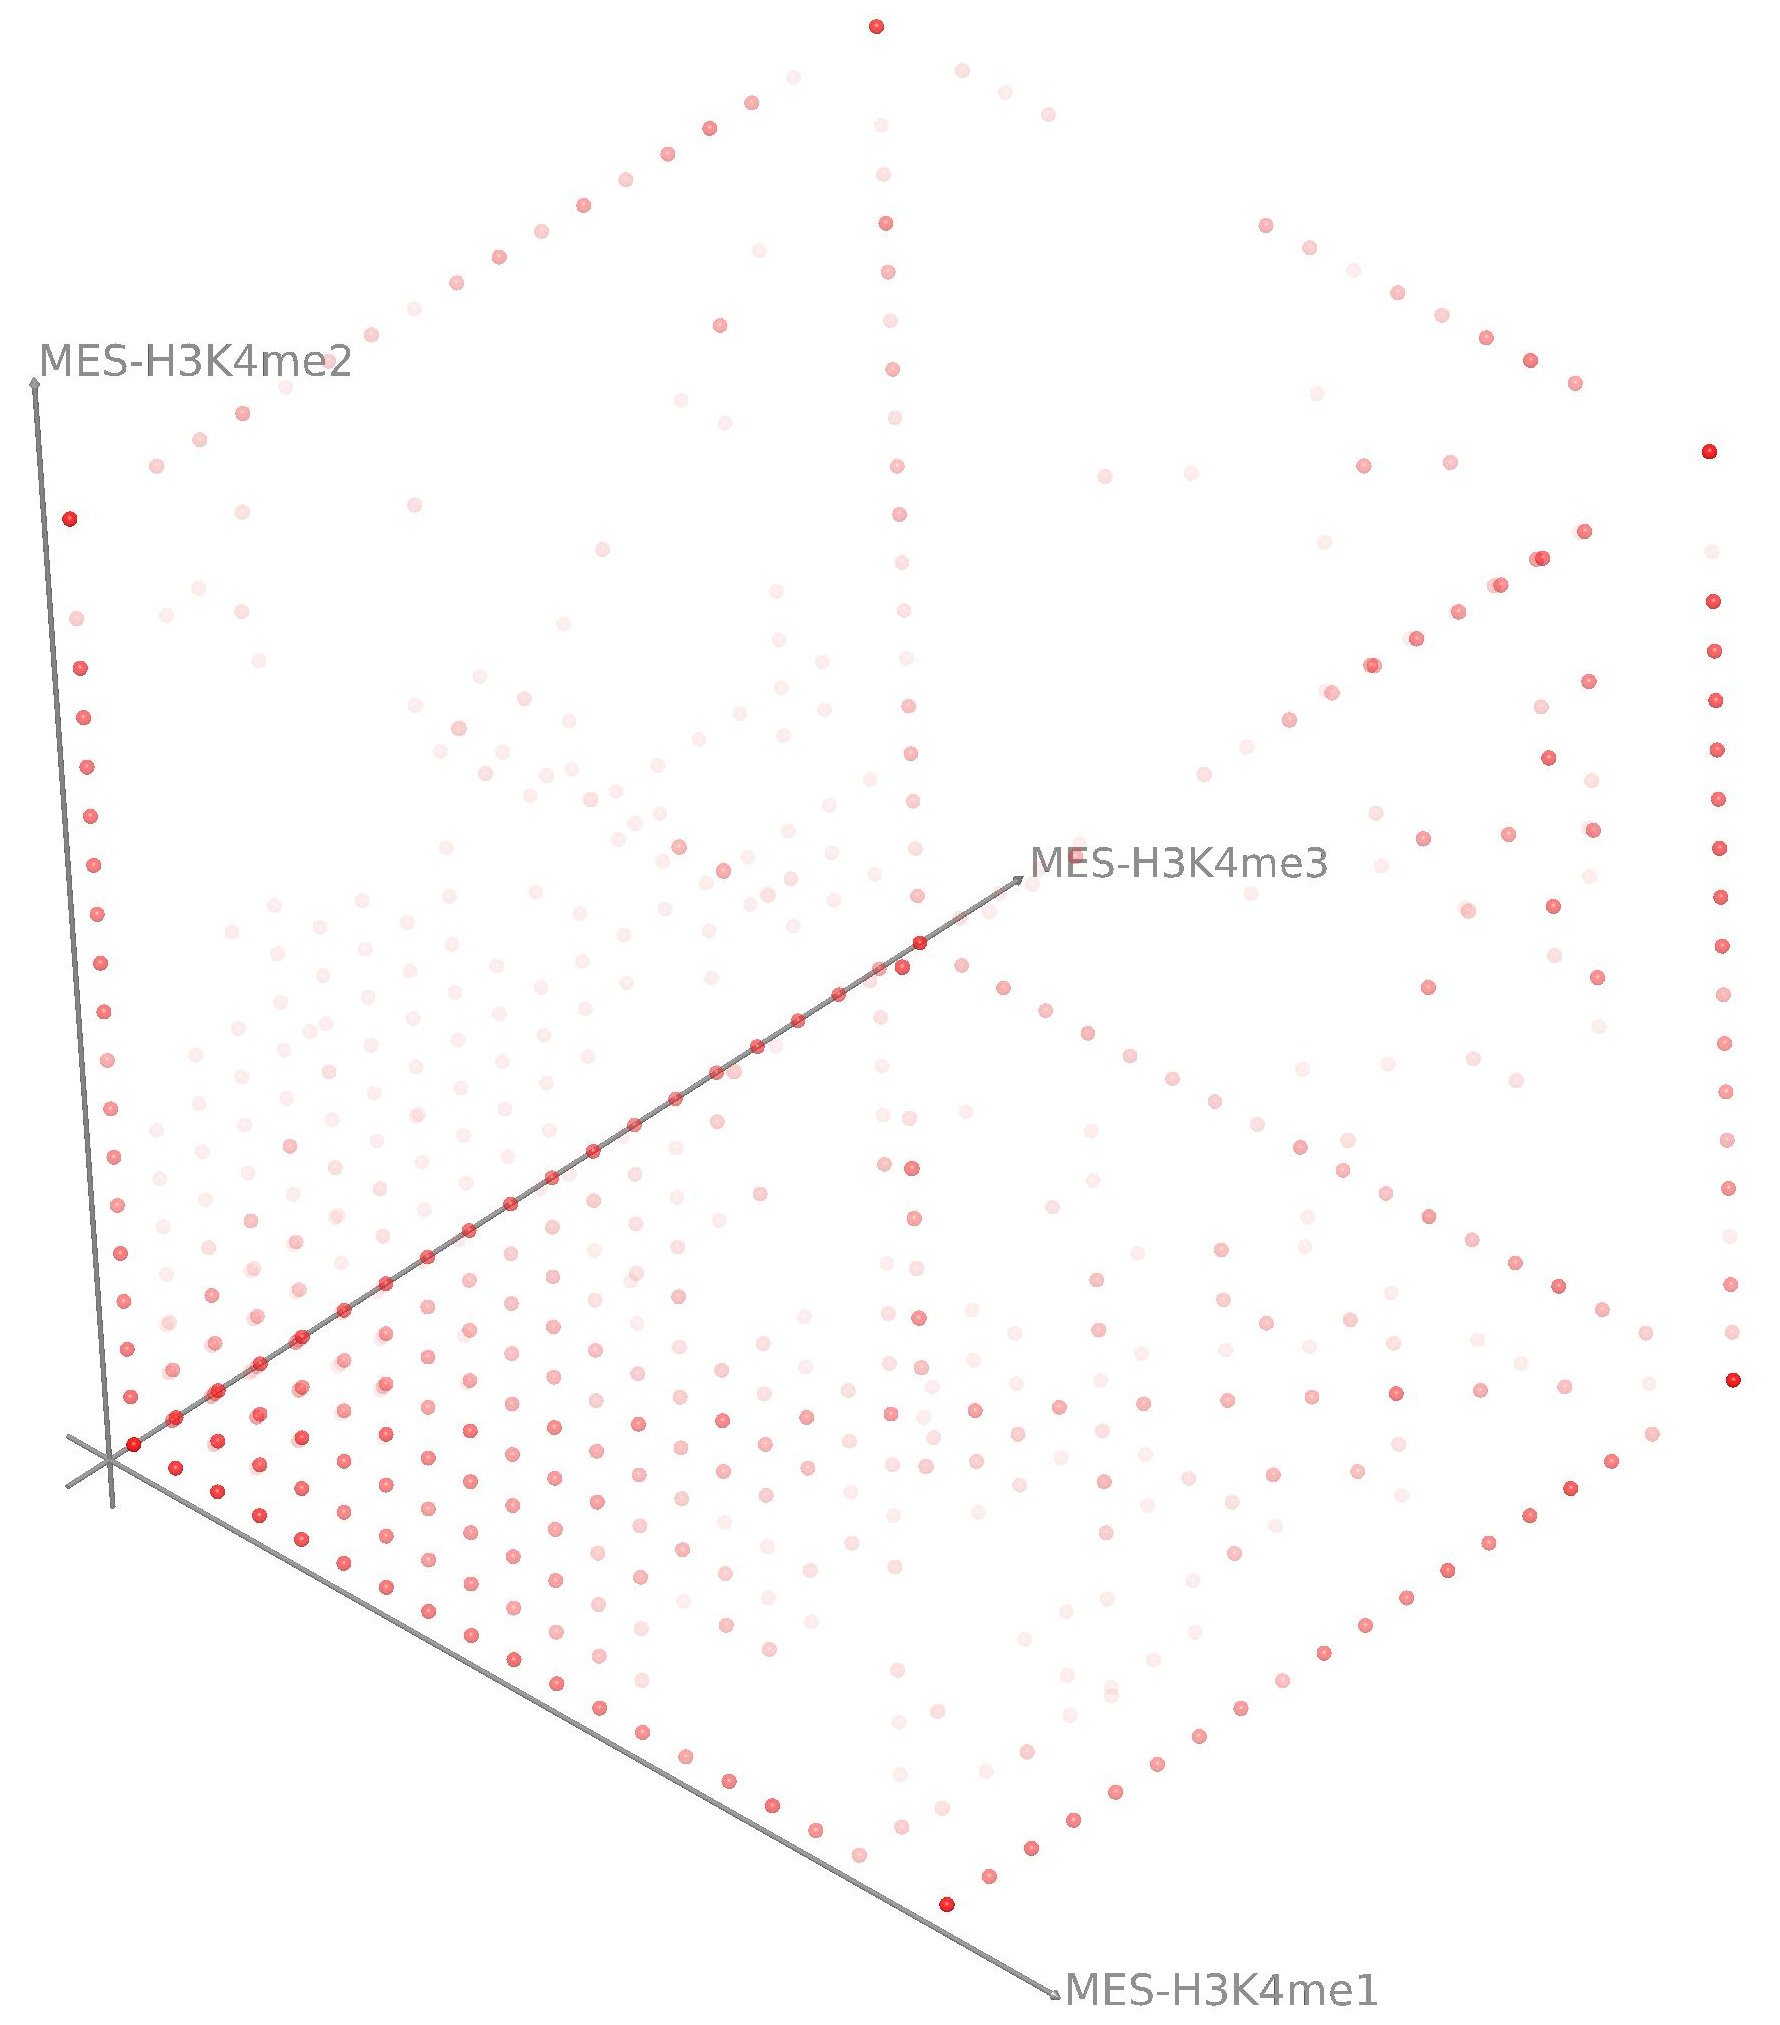
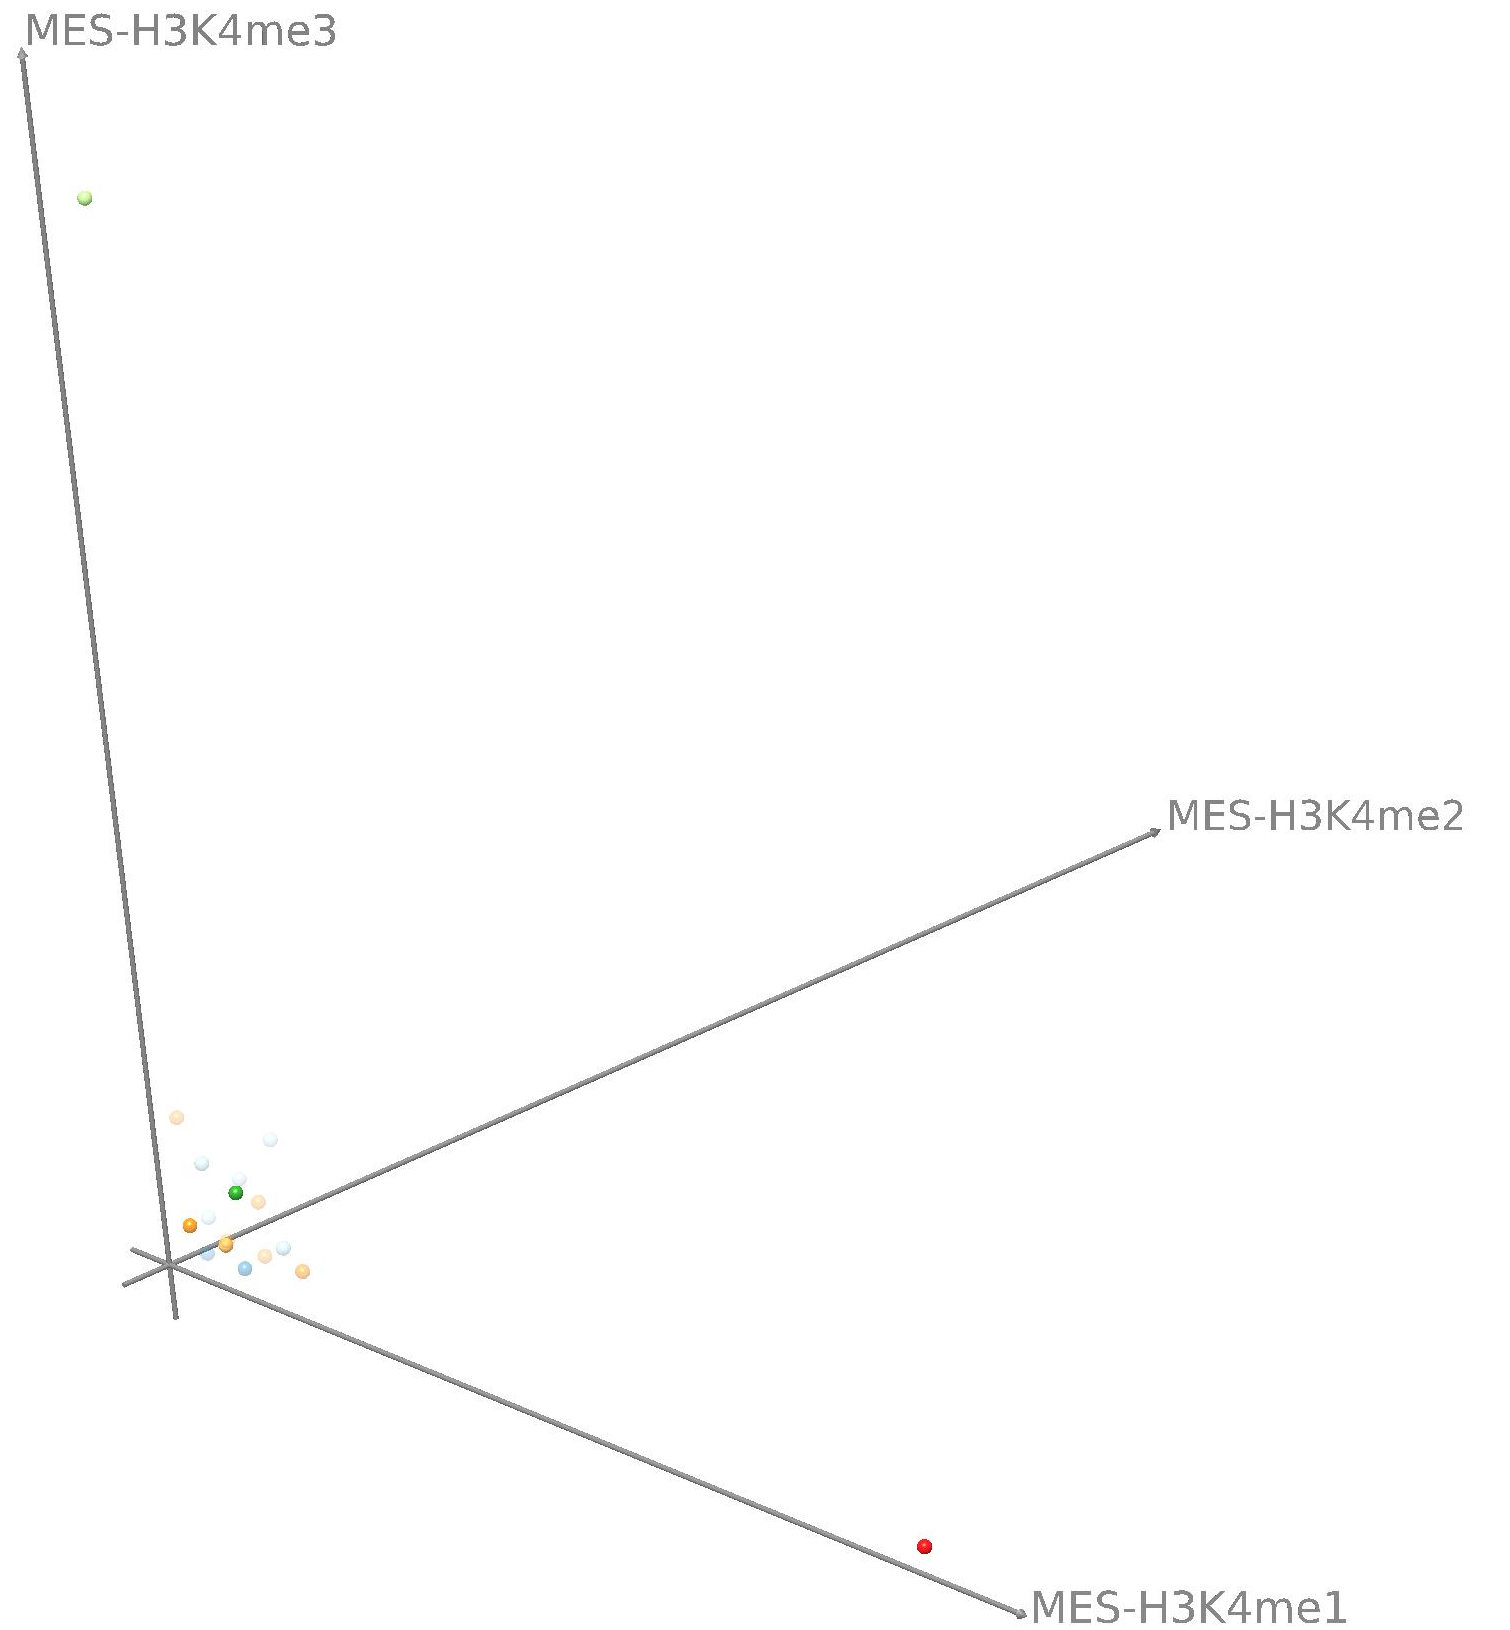
Current state of the art visualization methods for the analysis of epigenetic data sets are not suited to represent the relationship between the combinatorial pattern of histone modifications and their regulatory effects. A recent strategy to generate a global overview of these interactions is the use of scatterplots. One of the biggest weaknesses of scatterplots is the overplotting. This can be solved using a 2D tiled-binned representation strategy, where dividing scatterplot into bins consisting of tiles for each modification pattern is possible. However, this 2D strategy does not allow to represent the interaction of more than two histone modifications.
Here, TiBi-3D, a tool that can visualize the combinatorics of histone modifications with tiled-binned 3D scatterplots, is presented. Two important features of TiBi-3D are that tiles are represented with spheres in the scatterplot, and that their position and color encodes the histone modification pattern they represent. TiBi-3D also includes a transparency value assigned to each of that spheres to depict the amount of data points in each bin. In addition, to reduce the occlusion in the scatterplot each transparency value is initially filtered by an outlier detection, transformed to log scale, and then normalized. TiBi-3D provides features for exploration and interaction with the scatterplot and the data, thus enabling to examine the data set thoroughly. It is also possible to export the results as figures or in bed file format for further processing. By using TiBi-3D, for example, it was possible to observe new relations between the CpG-density and histone modifications in different cell types. In conclusion, TiBi-3D is an excellent tool for the analysis of global patterns in epigenetic data.