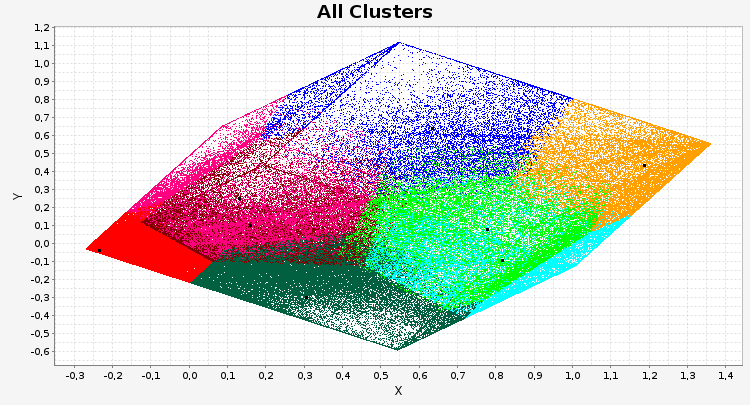
Epigenetics studies heritable phenotypic changes which are not due to changes in the DNA sequence. The molecular basis is chromatin forming a “beads on a string”-like structure of histones. Here we present a new tool called ChromatinVis to visualize ChIP-seq data. Before visualization, the histone modification data is segmented typically yielding several millions of data points. In our example, we process data from three cell types and three modifications resulting in eight combinations. The challenging problem is to study the global changes of histone modifications between different cell types. The data are clustered using the k means++ algorithm. For each cluster we allow the user to study the global and local distribution of histone marks using radial windmill charts. To analyze the configuration of the clusters in the data space we use scatterplots in combination with a Principle Component Analyses. A multitude of filtering options and several methods for outlier detection, like calculation of silhouette coefficients, allow the user to improve clustering. From a biological perspective, the tool gives a deeper insight into relationship between histone modifications.
Published as a poster at the Vizbi 2014 conference.