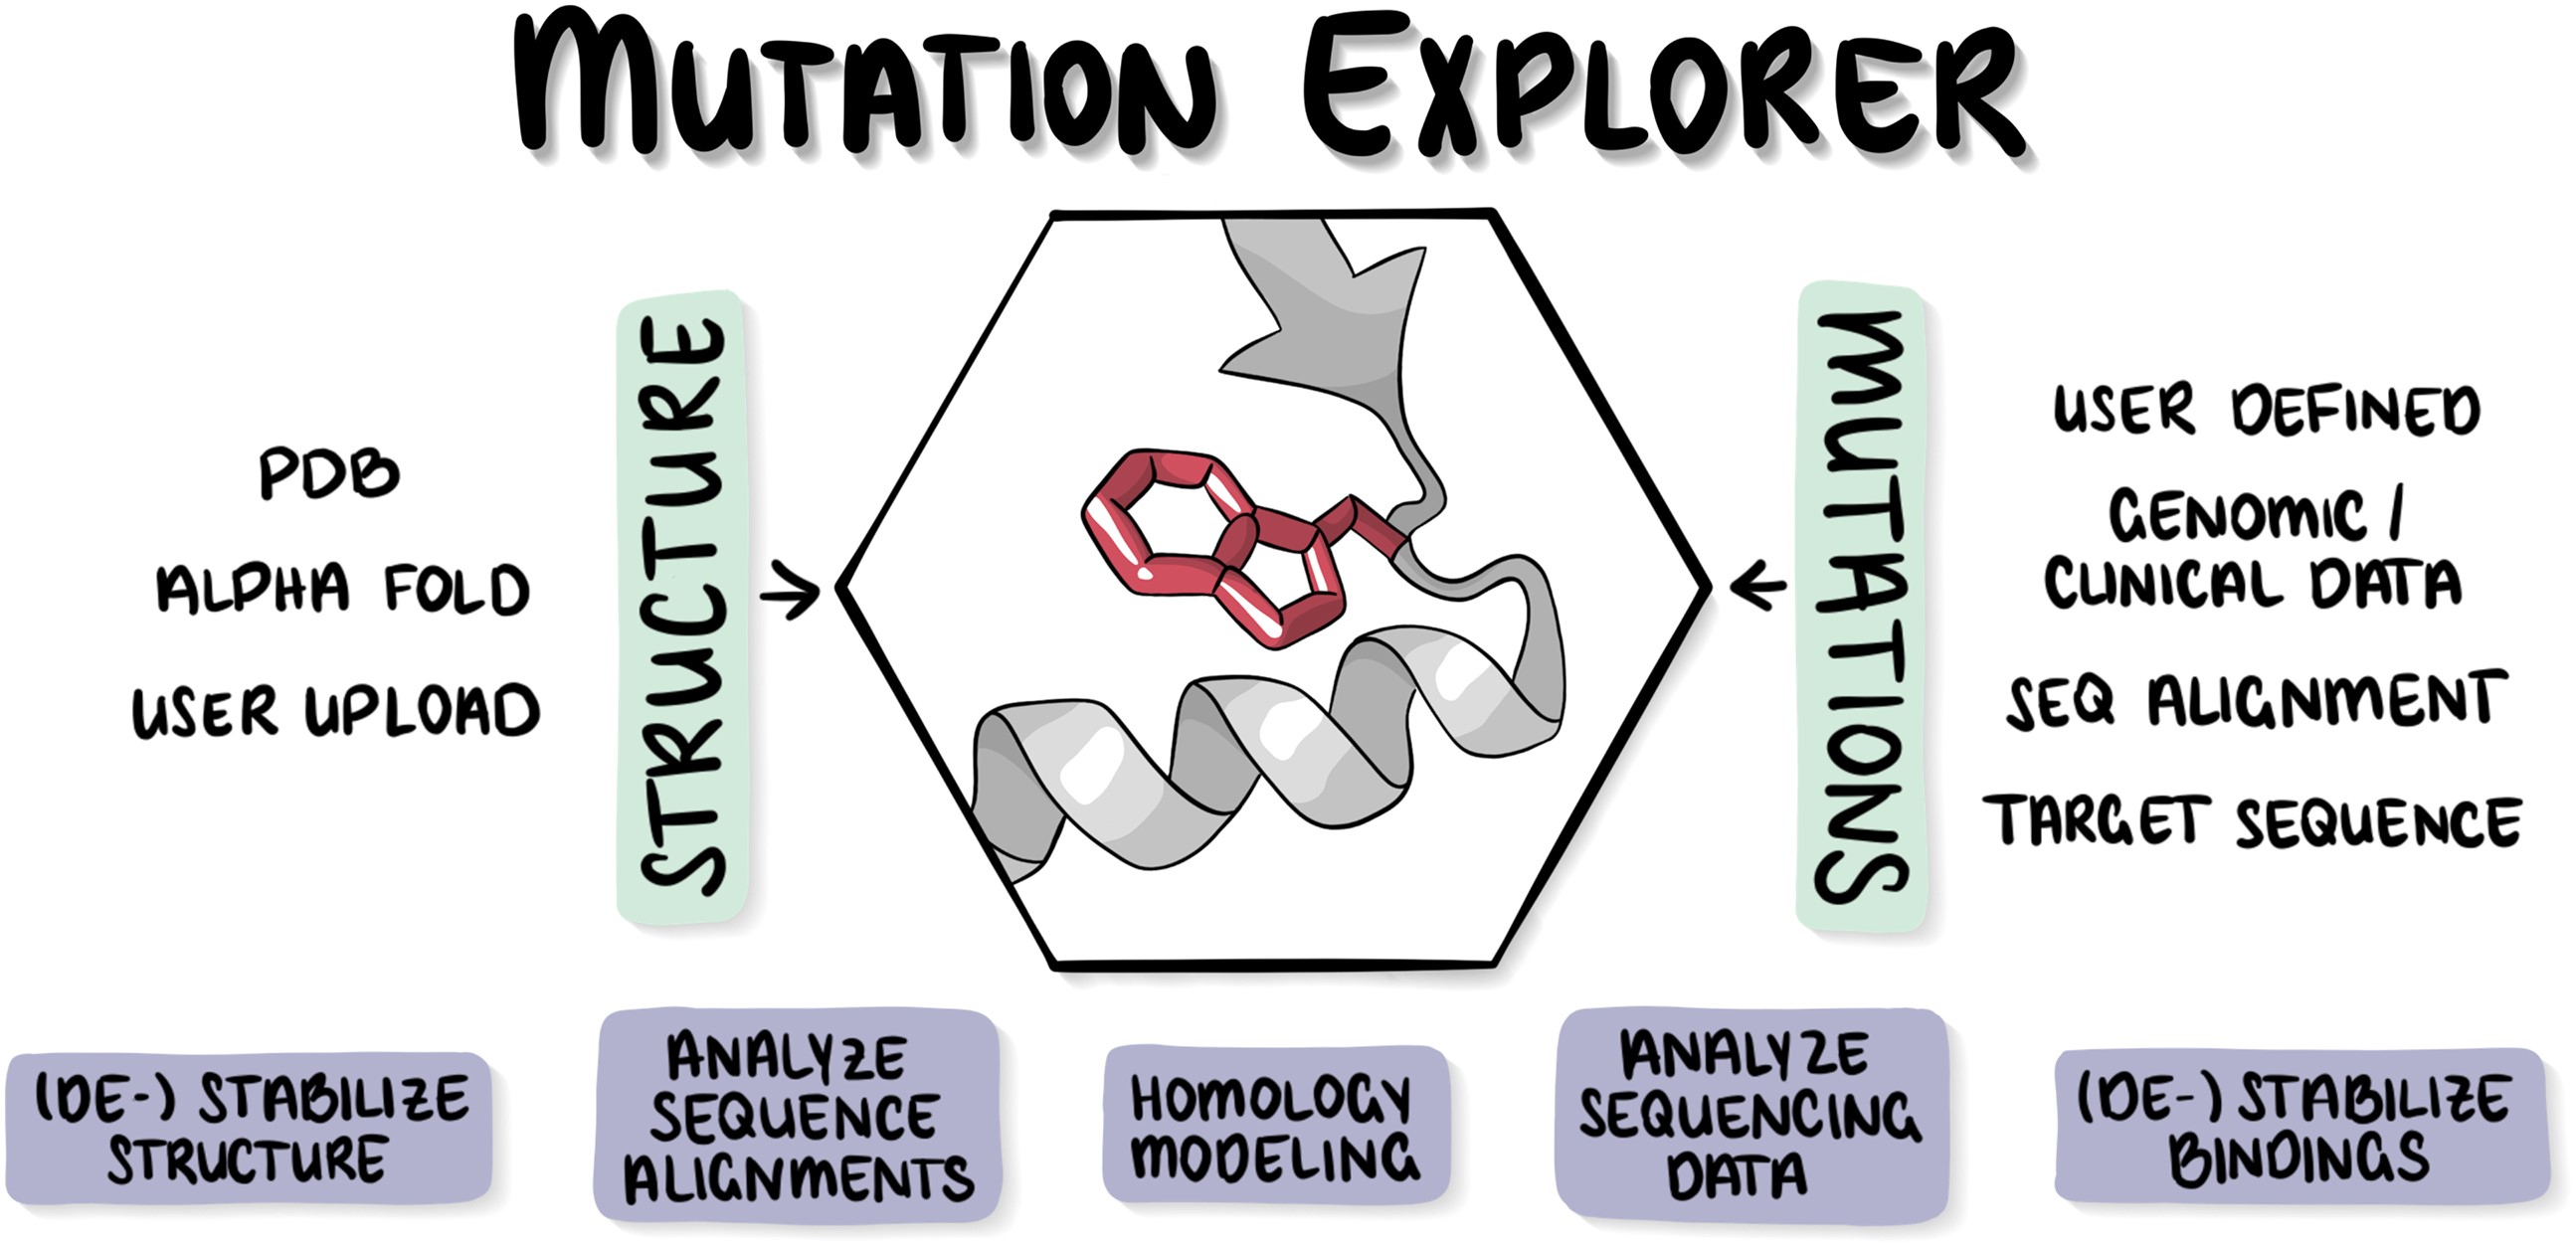
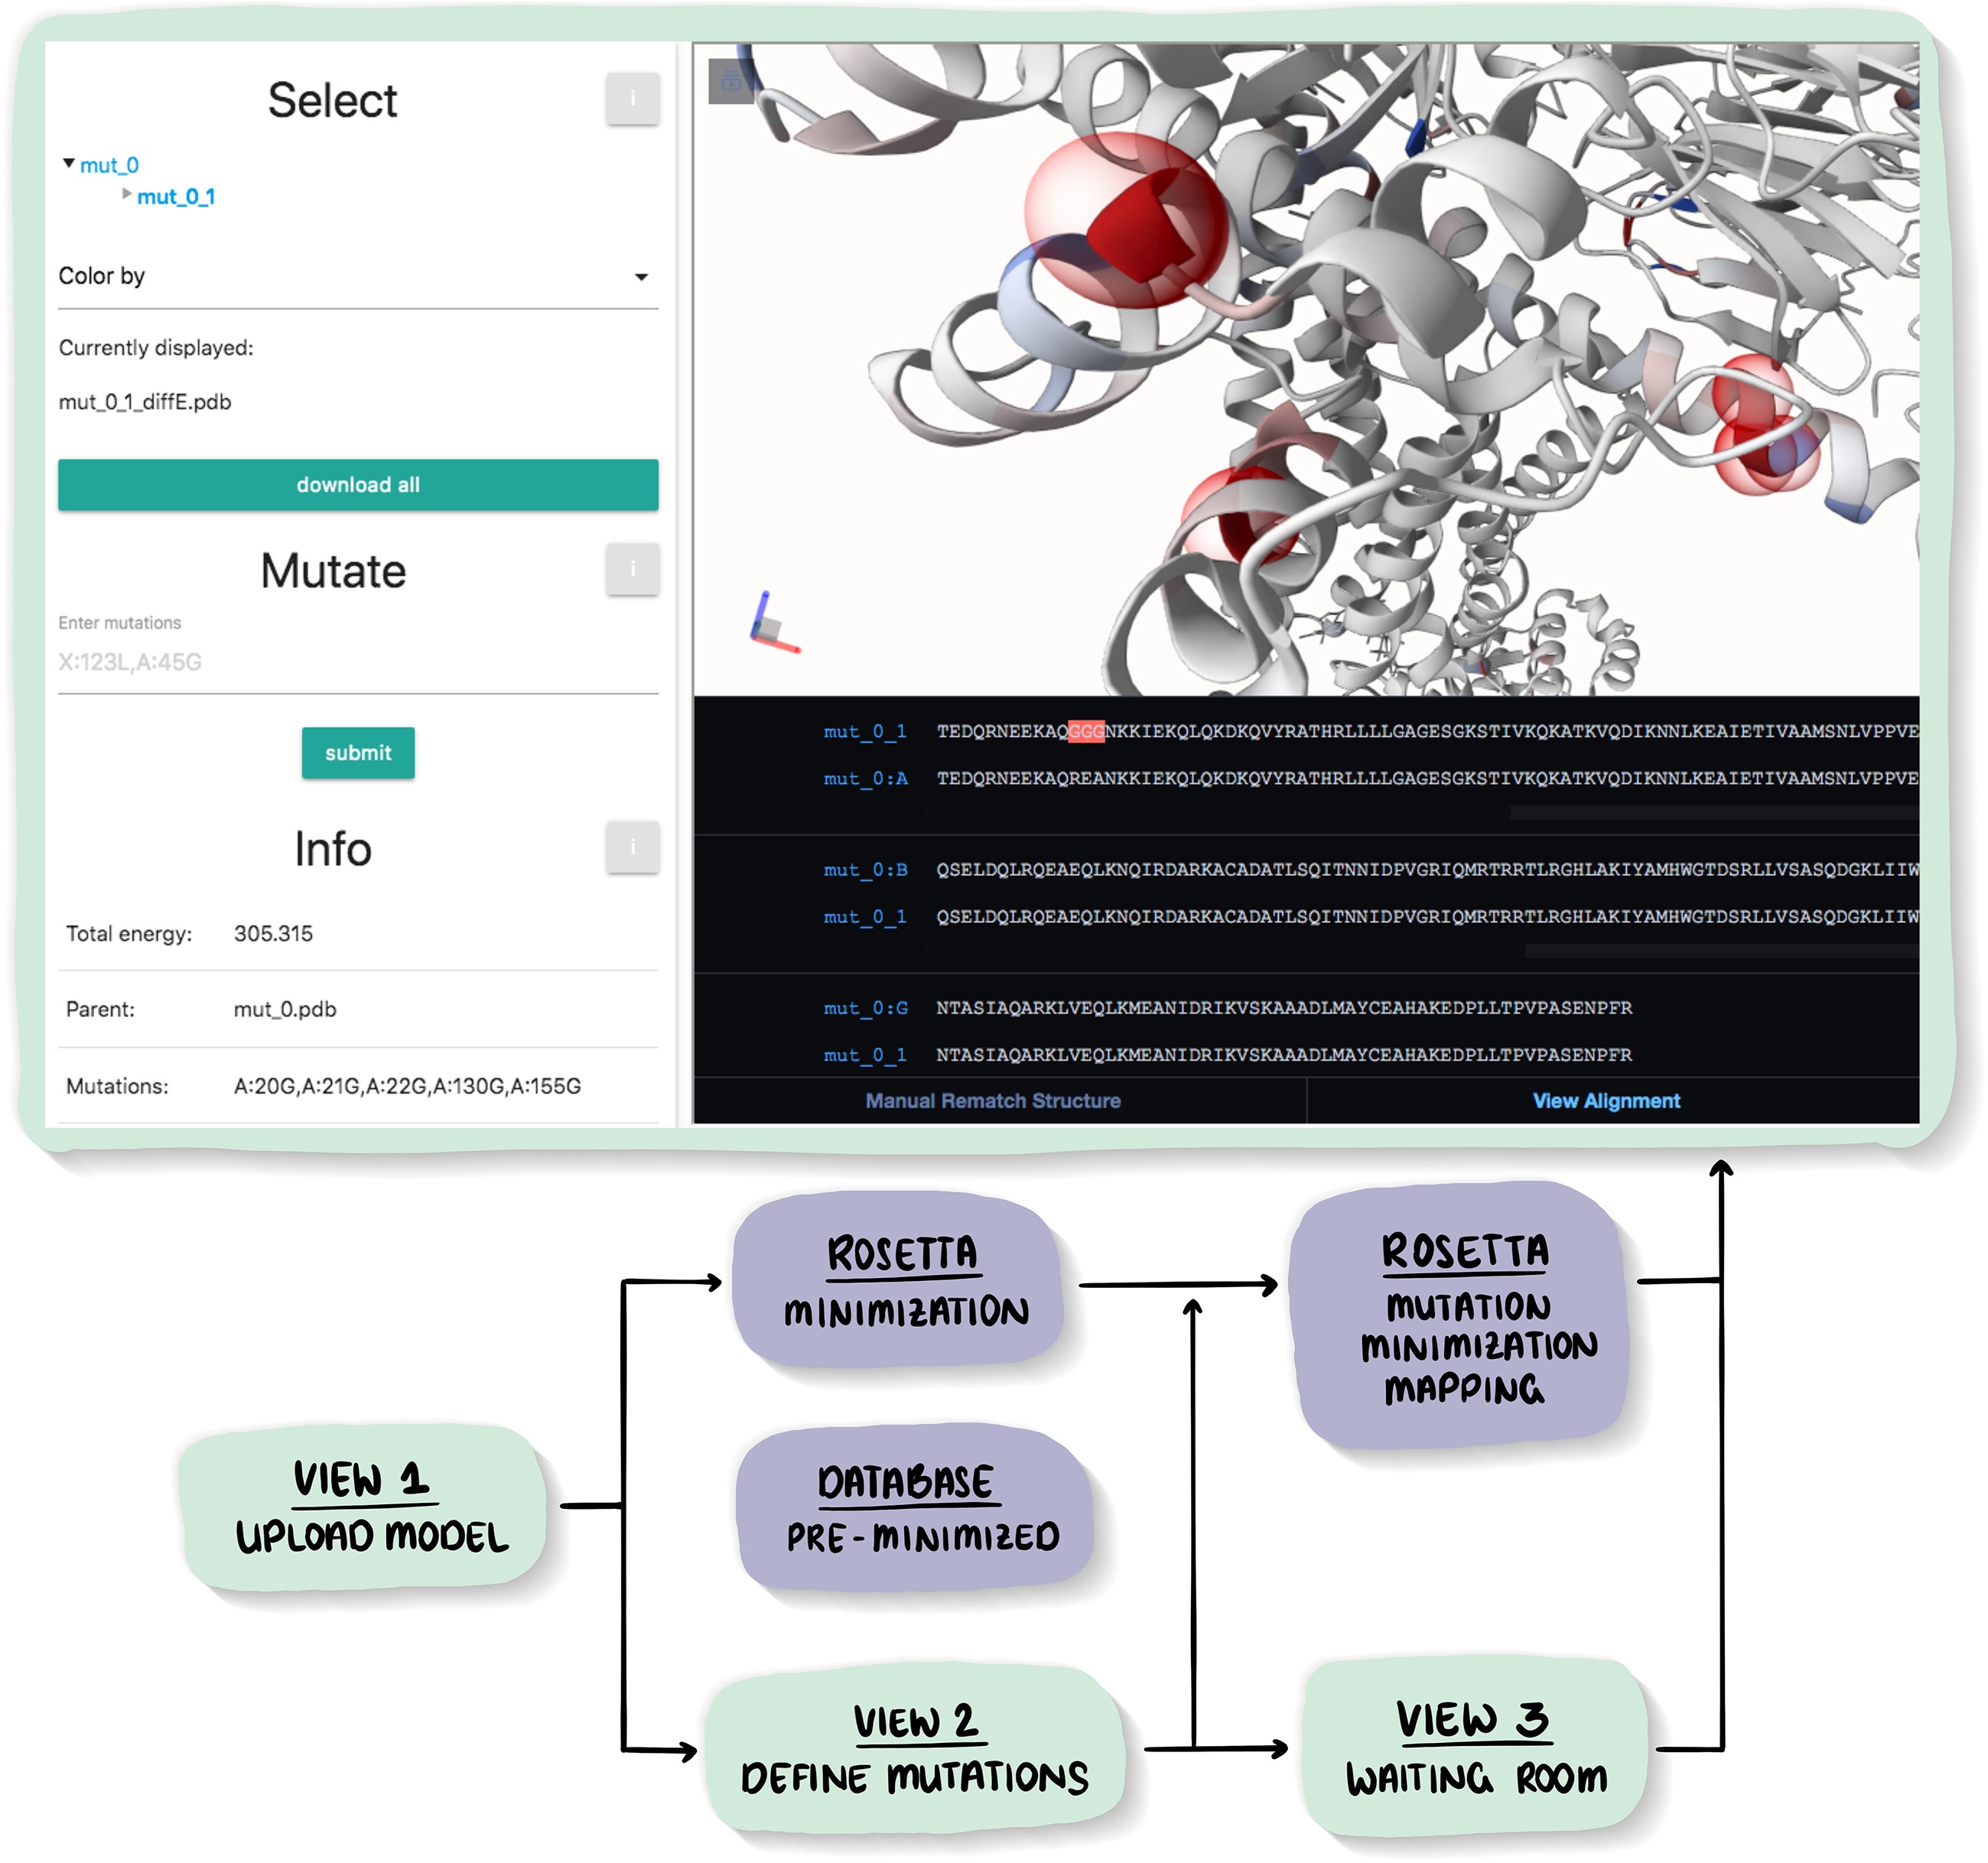
The possible effects of mutations on stability and function of a protein can only be understood in the context of protein 3D structure. The MutationExplorer webserver maps sequence changes onto protein structures and allows users to study variation by inputting sequence changes. As the user enters variants, the 3D model evolves, and estimated changes in energy are highlighted. In addition to a basic per-residue input format, MutationExplorer can also upload an entire replacement sequence. Previously the purview of desktop applications, such an upload can back-mutate PDB structures to wildtype sequence in a single step. Another supported variation source is human single nucelotide polymorphisms (SNPs), genomic coordinates input in VCF format. Structures are flexibly colorable, not only by energetic differences, but also by hydrophobicity, sequence conservation, or other biochemical profiling. Coloring by interface score reveals mutation impacts on binding surfaces. MutationExplorer strives for efficiency in user experience. For example, we have prepared 45 000 PDB depositions for instant retrieval and initial display. All modeling steps are performed by Rosetta. Visualizations leverage MDsrv/Mol*. MutationExplorer is available at: Link.
Publication: Link
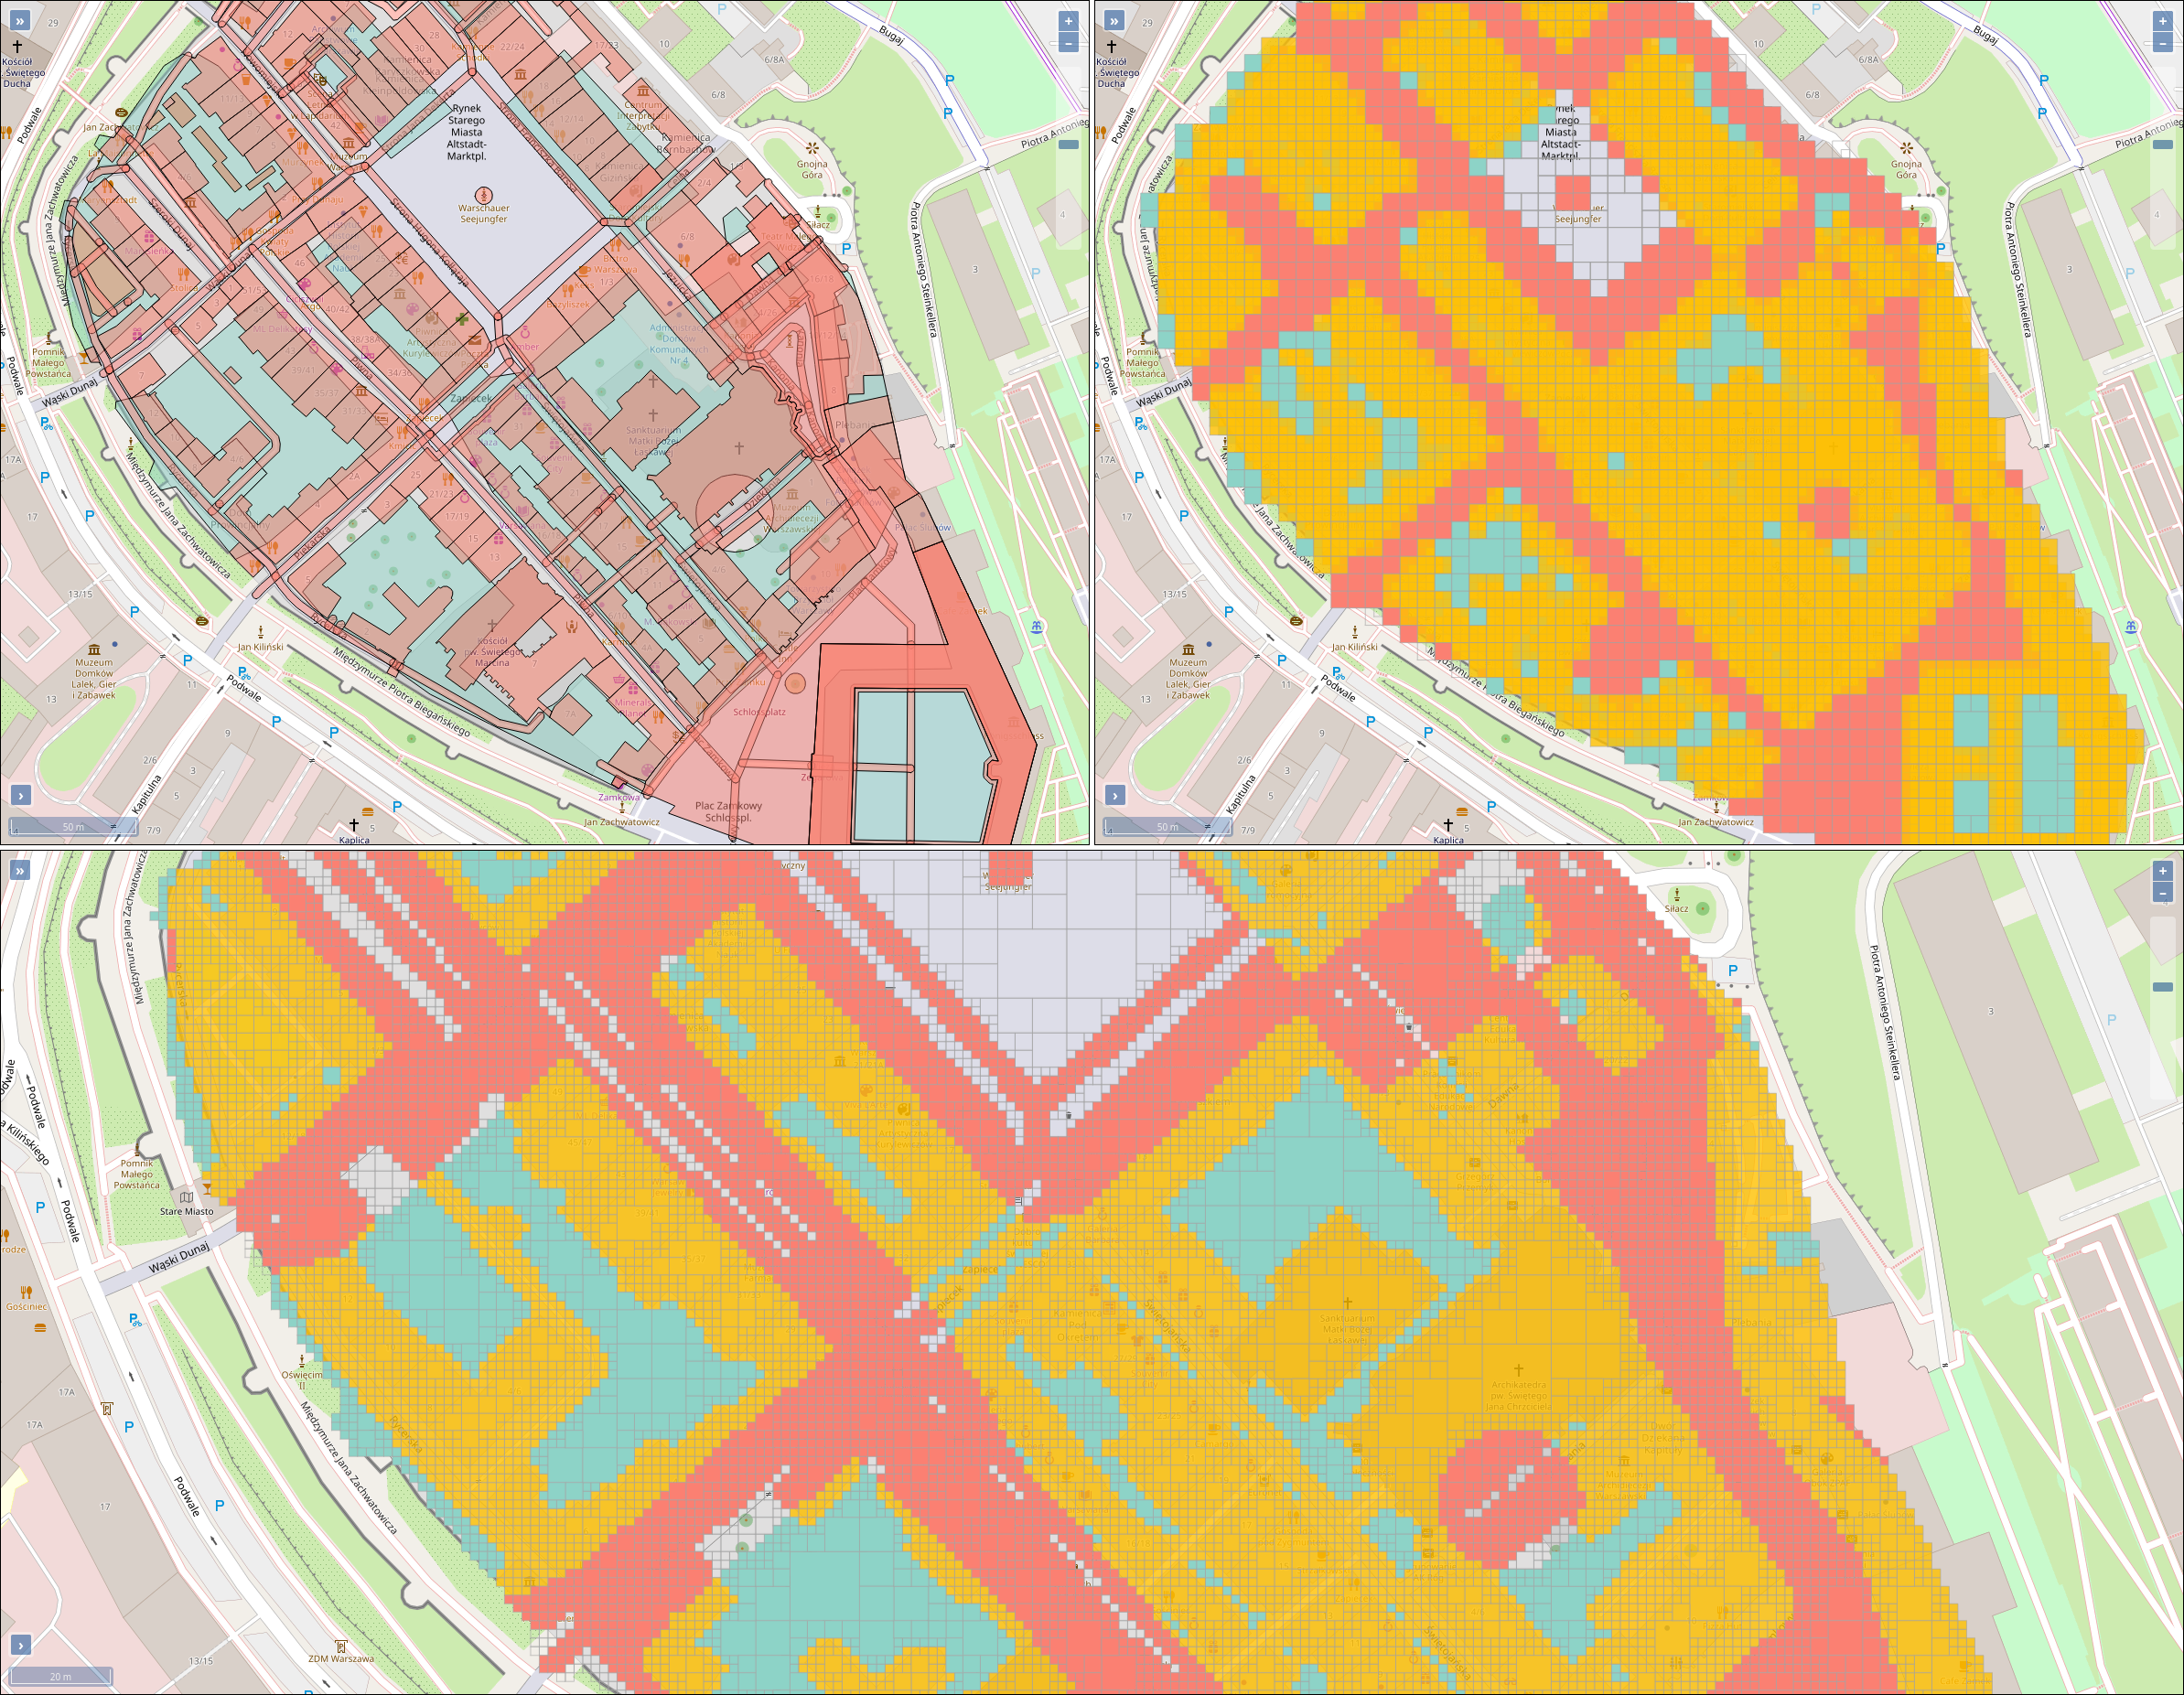
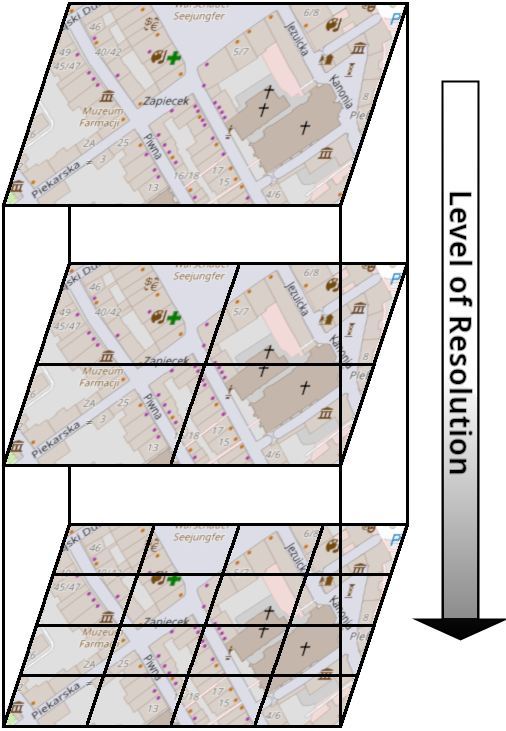
This paper describes an innovative computational approach for comparing old maps. Maps older than 20 years remain a vast treasure of geographic information in many parts of the world with potential applications in many environmental and social analyses, e.g., establishing road construction over the past 80 years or identifying settlement growth since the middle ages. Semantic segmentation has developed into a viable computational method for analysing old maps from previous centuries. It allows for the discrete identification of elements, e.g., lakes, forests, and roads, from cartographic sources and their computational modelling. Semantic segmentation uses convolutional neural networks to extract elements. With this technique, we create a computational approach to compare old maps systematically and efficiently.
Visualization has many important tasks and is often used for example for exploration and analysis of data in computational biology. In this field of research, many experiments are conducted multiple times, sometimes experiments are repeated years later. The software for analyzing the data derived from these experiments must therefore meet high quality standards, so that the results of experiments are reproducible. Therefore, the FAIR principles are often applied to the software used in this field. In my talk I want to share my experiences on the implementation of the FAIR principle for visualization software in the field of computational biology. These are to a large extent also transferable to general visualization software.
Invited lightning talk at the FairVis workshop organized as part of EuroVis23.
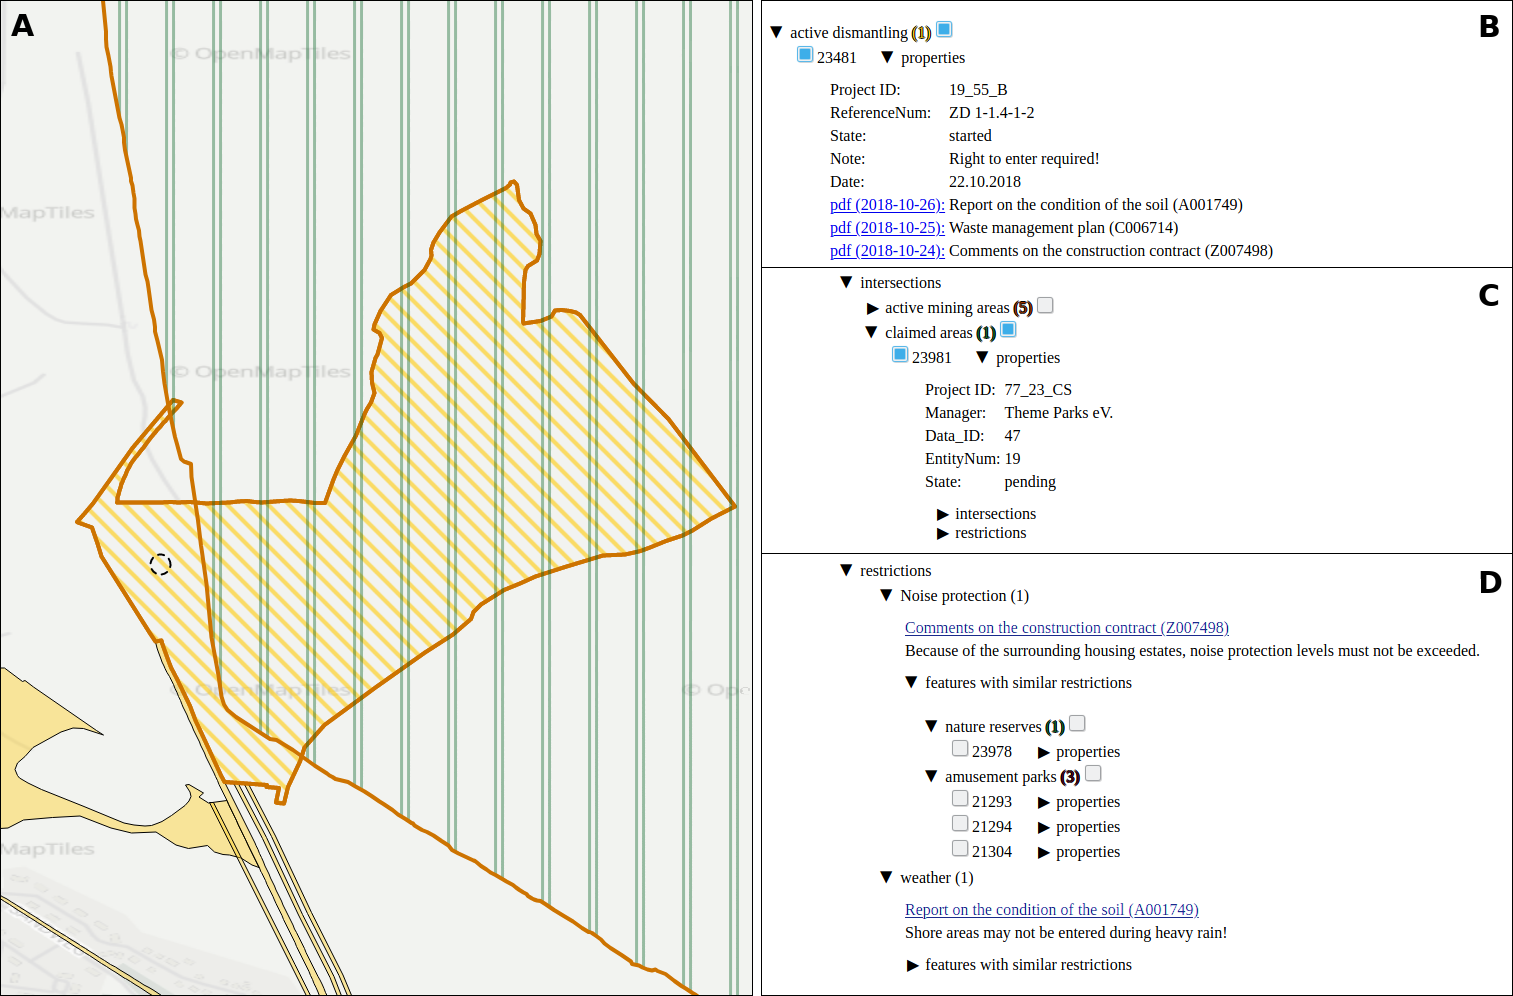
The operation of open-cast lignite mines is a large intervention in nature, making the areas uninhabitable even after closing the mines without renaturation processes. Renaturation of these large areas requires a regional planning process which is tied to many conditions and restrictions, such as environmental protection laws. The related information is available only as unstructured text in a variety of documents. Associated temporal aspects and the geographical borders to these textual information have to be linked manually so far. This process is highly time-consuming, error-prone, and tedious. Therefore, the knowledge of experts is often used, but this does not necessarily include all the relevant information. In this paper, we present a system to support the experts in decision-making of urban planning, renaturation, and redevelopment projects. The system allows to plan new projects, while considering spatial and temporal restrictions extracted from text documents. With this, our presented system can also be used to verify compliance with certain legal regulations, such as nature conservation laws.
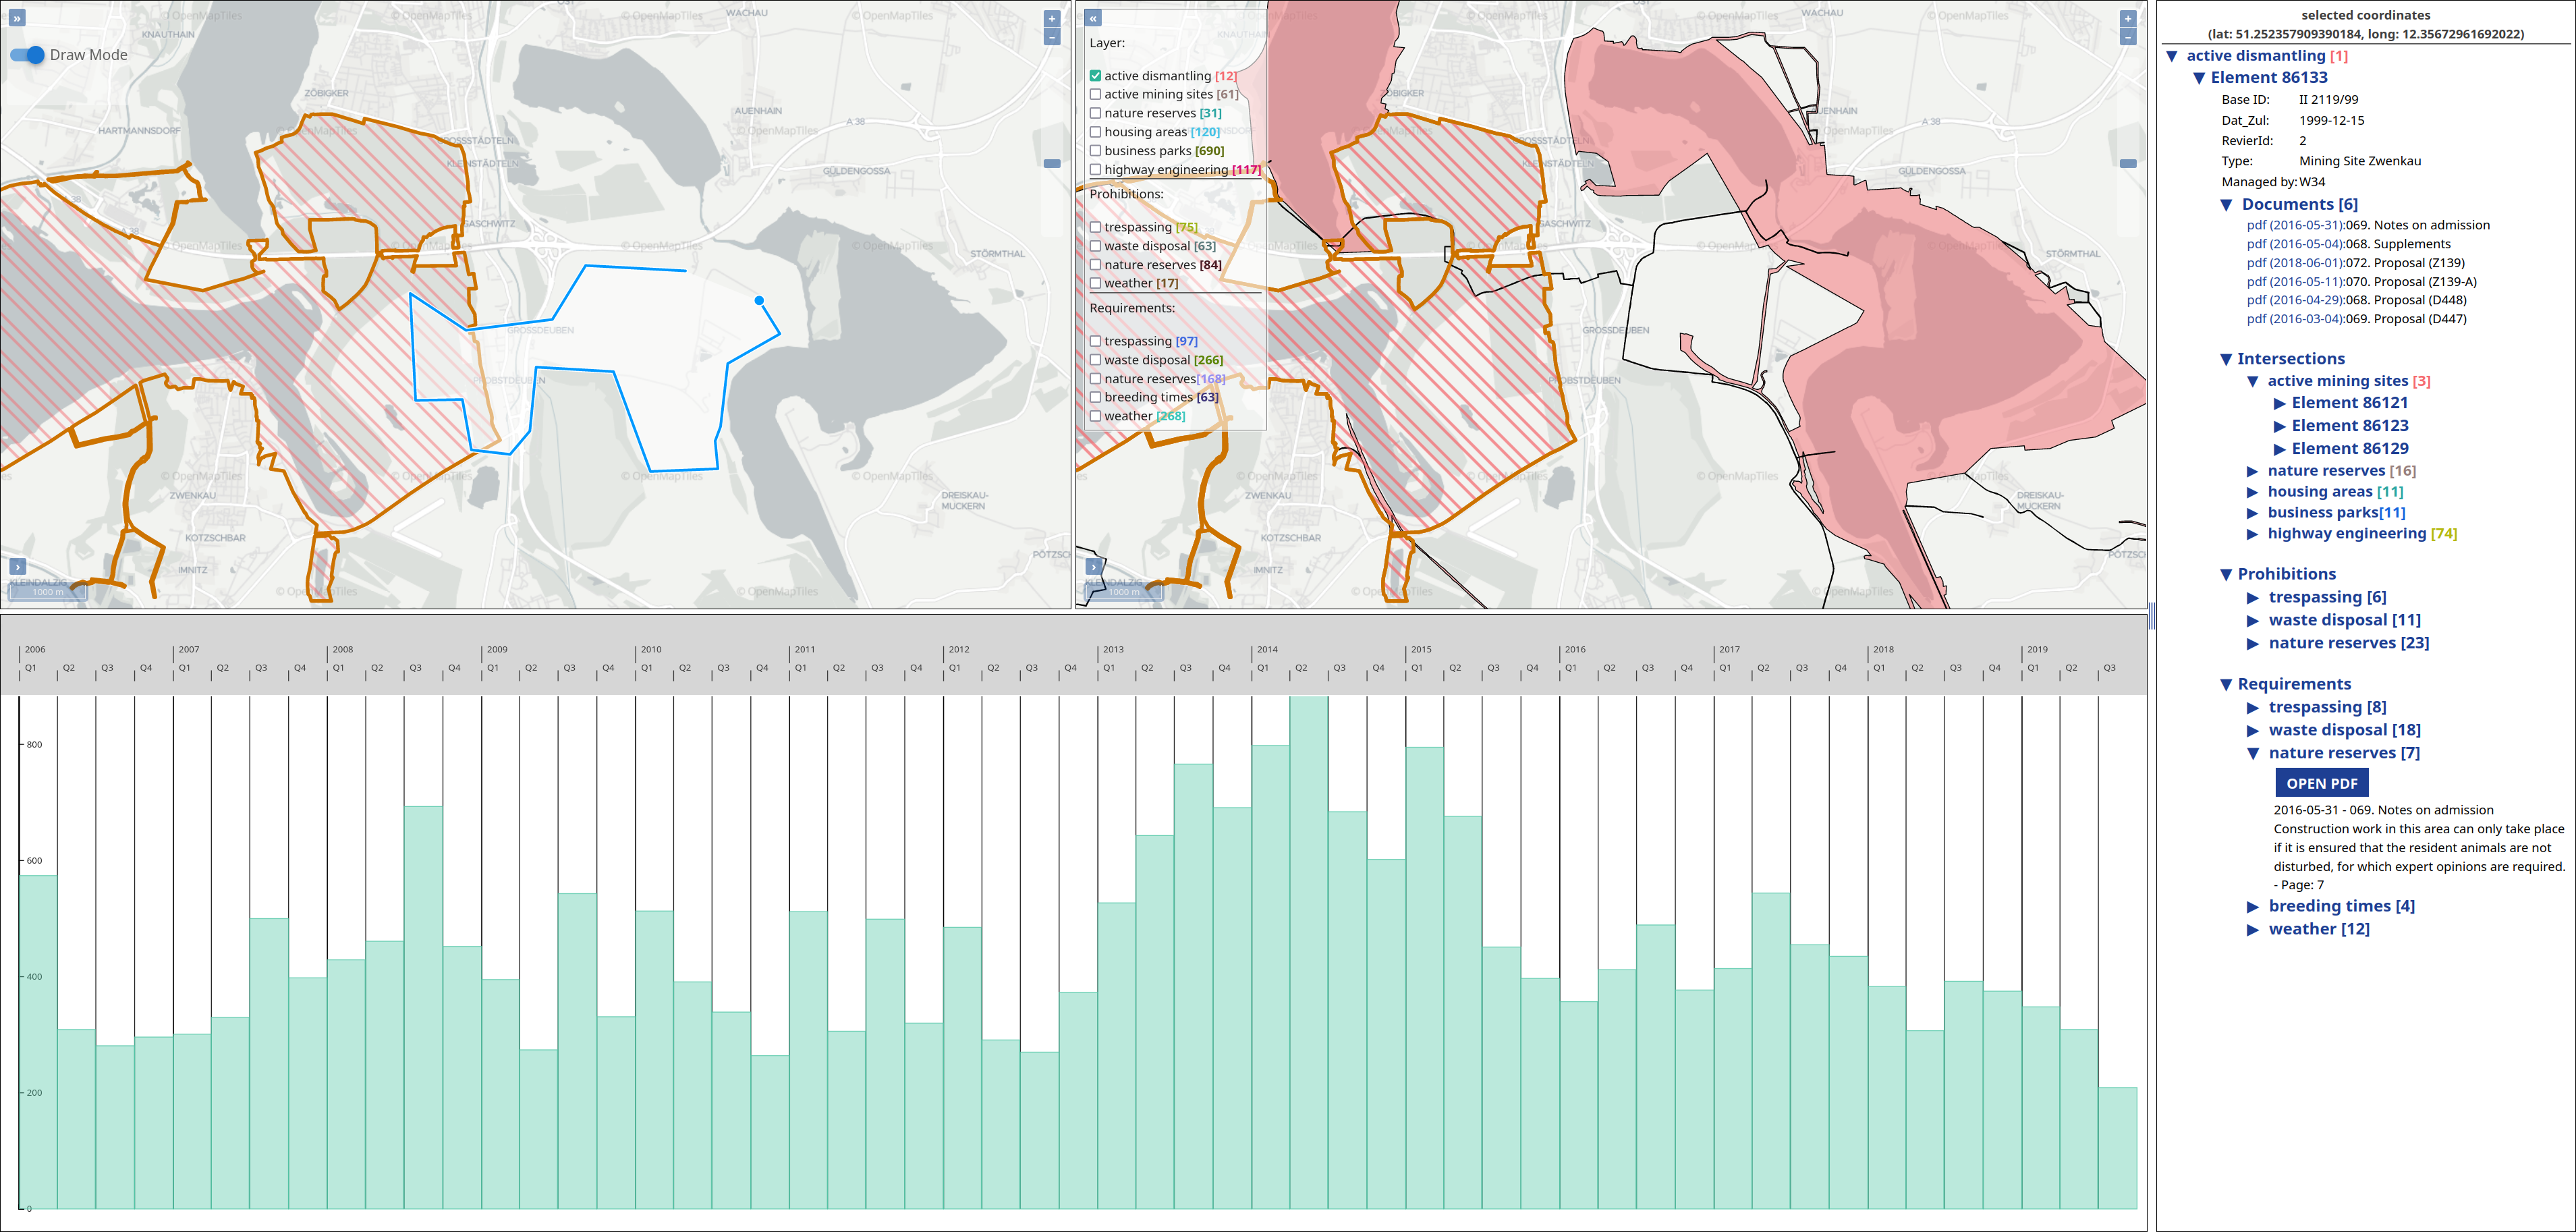
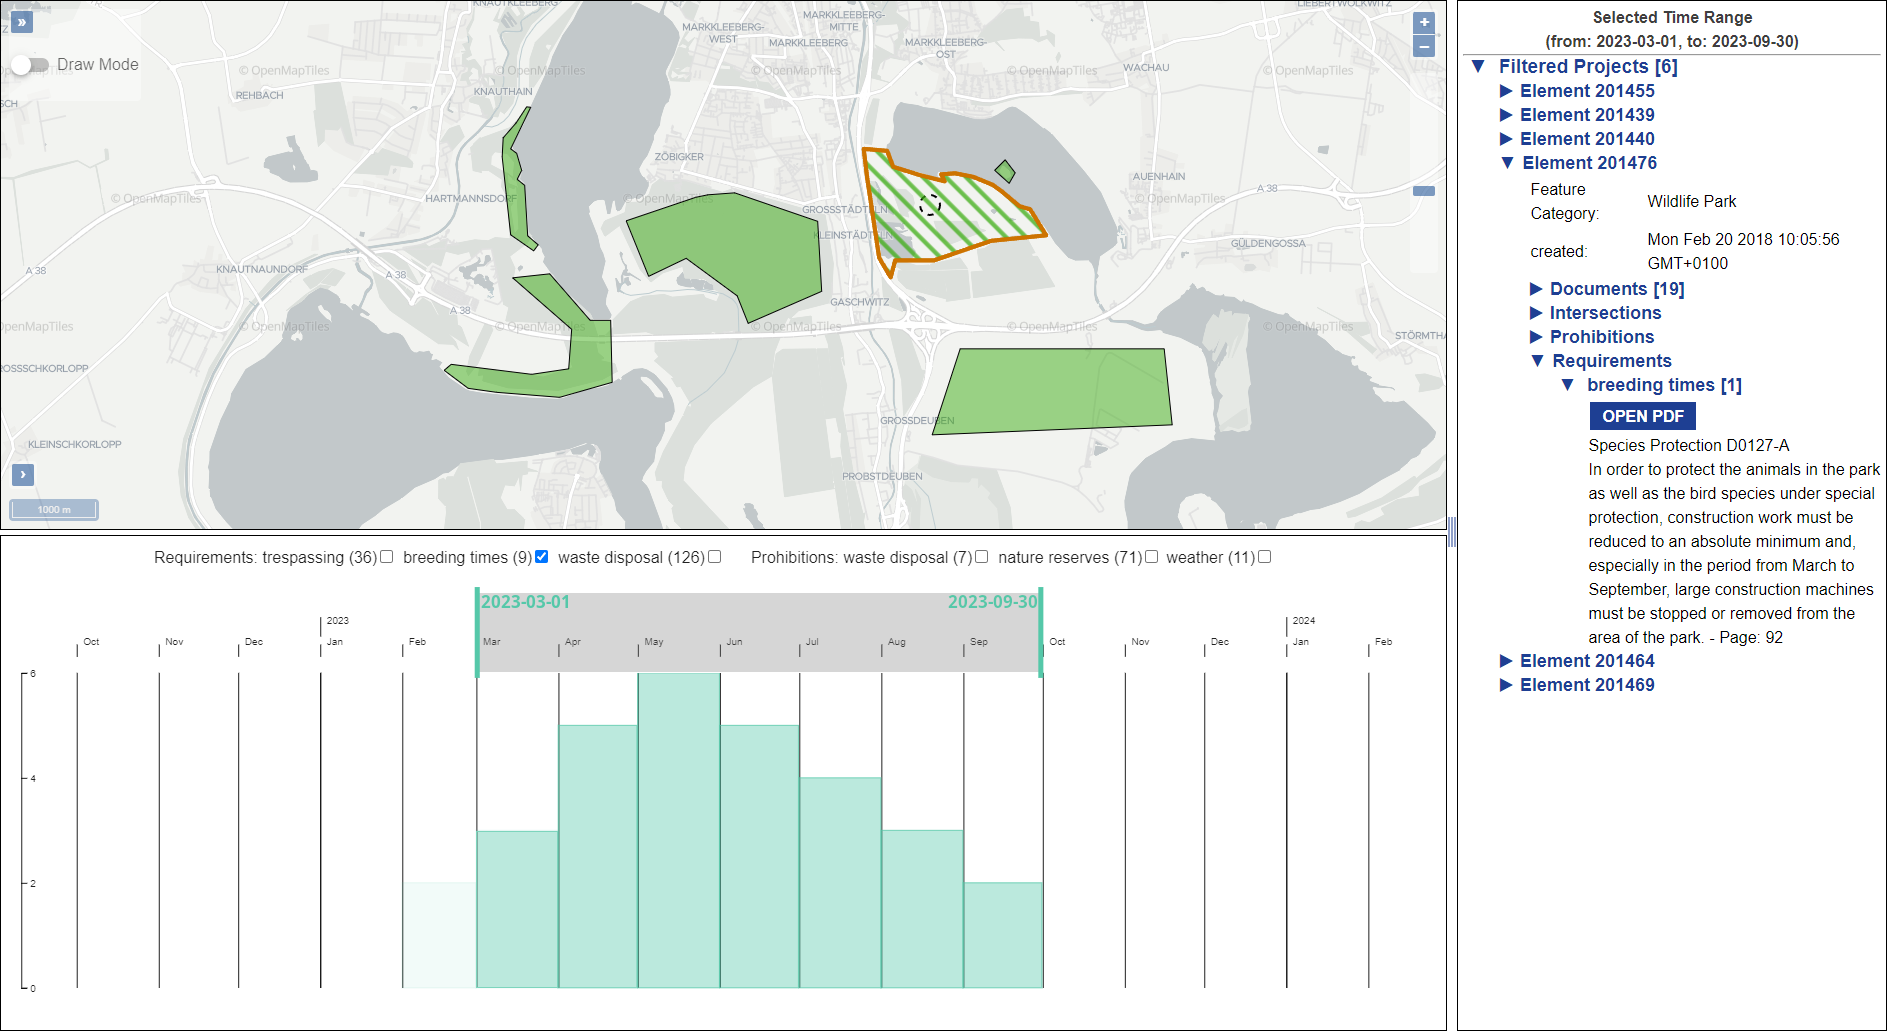
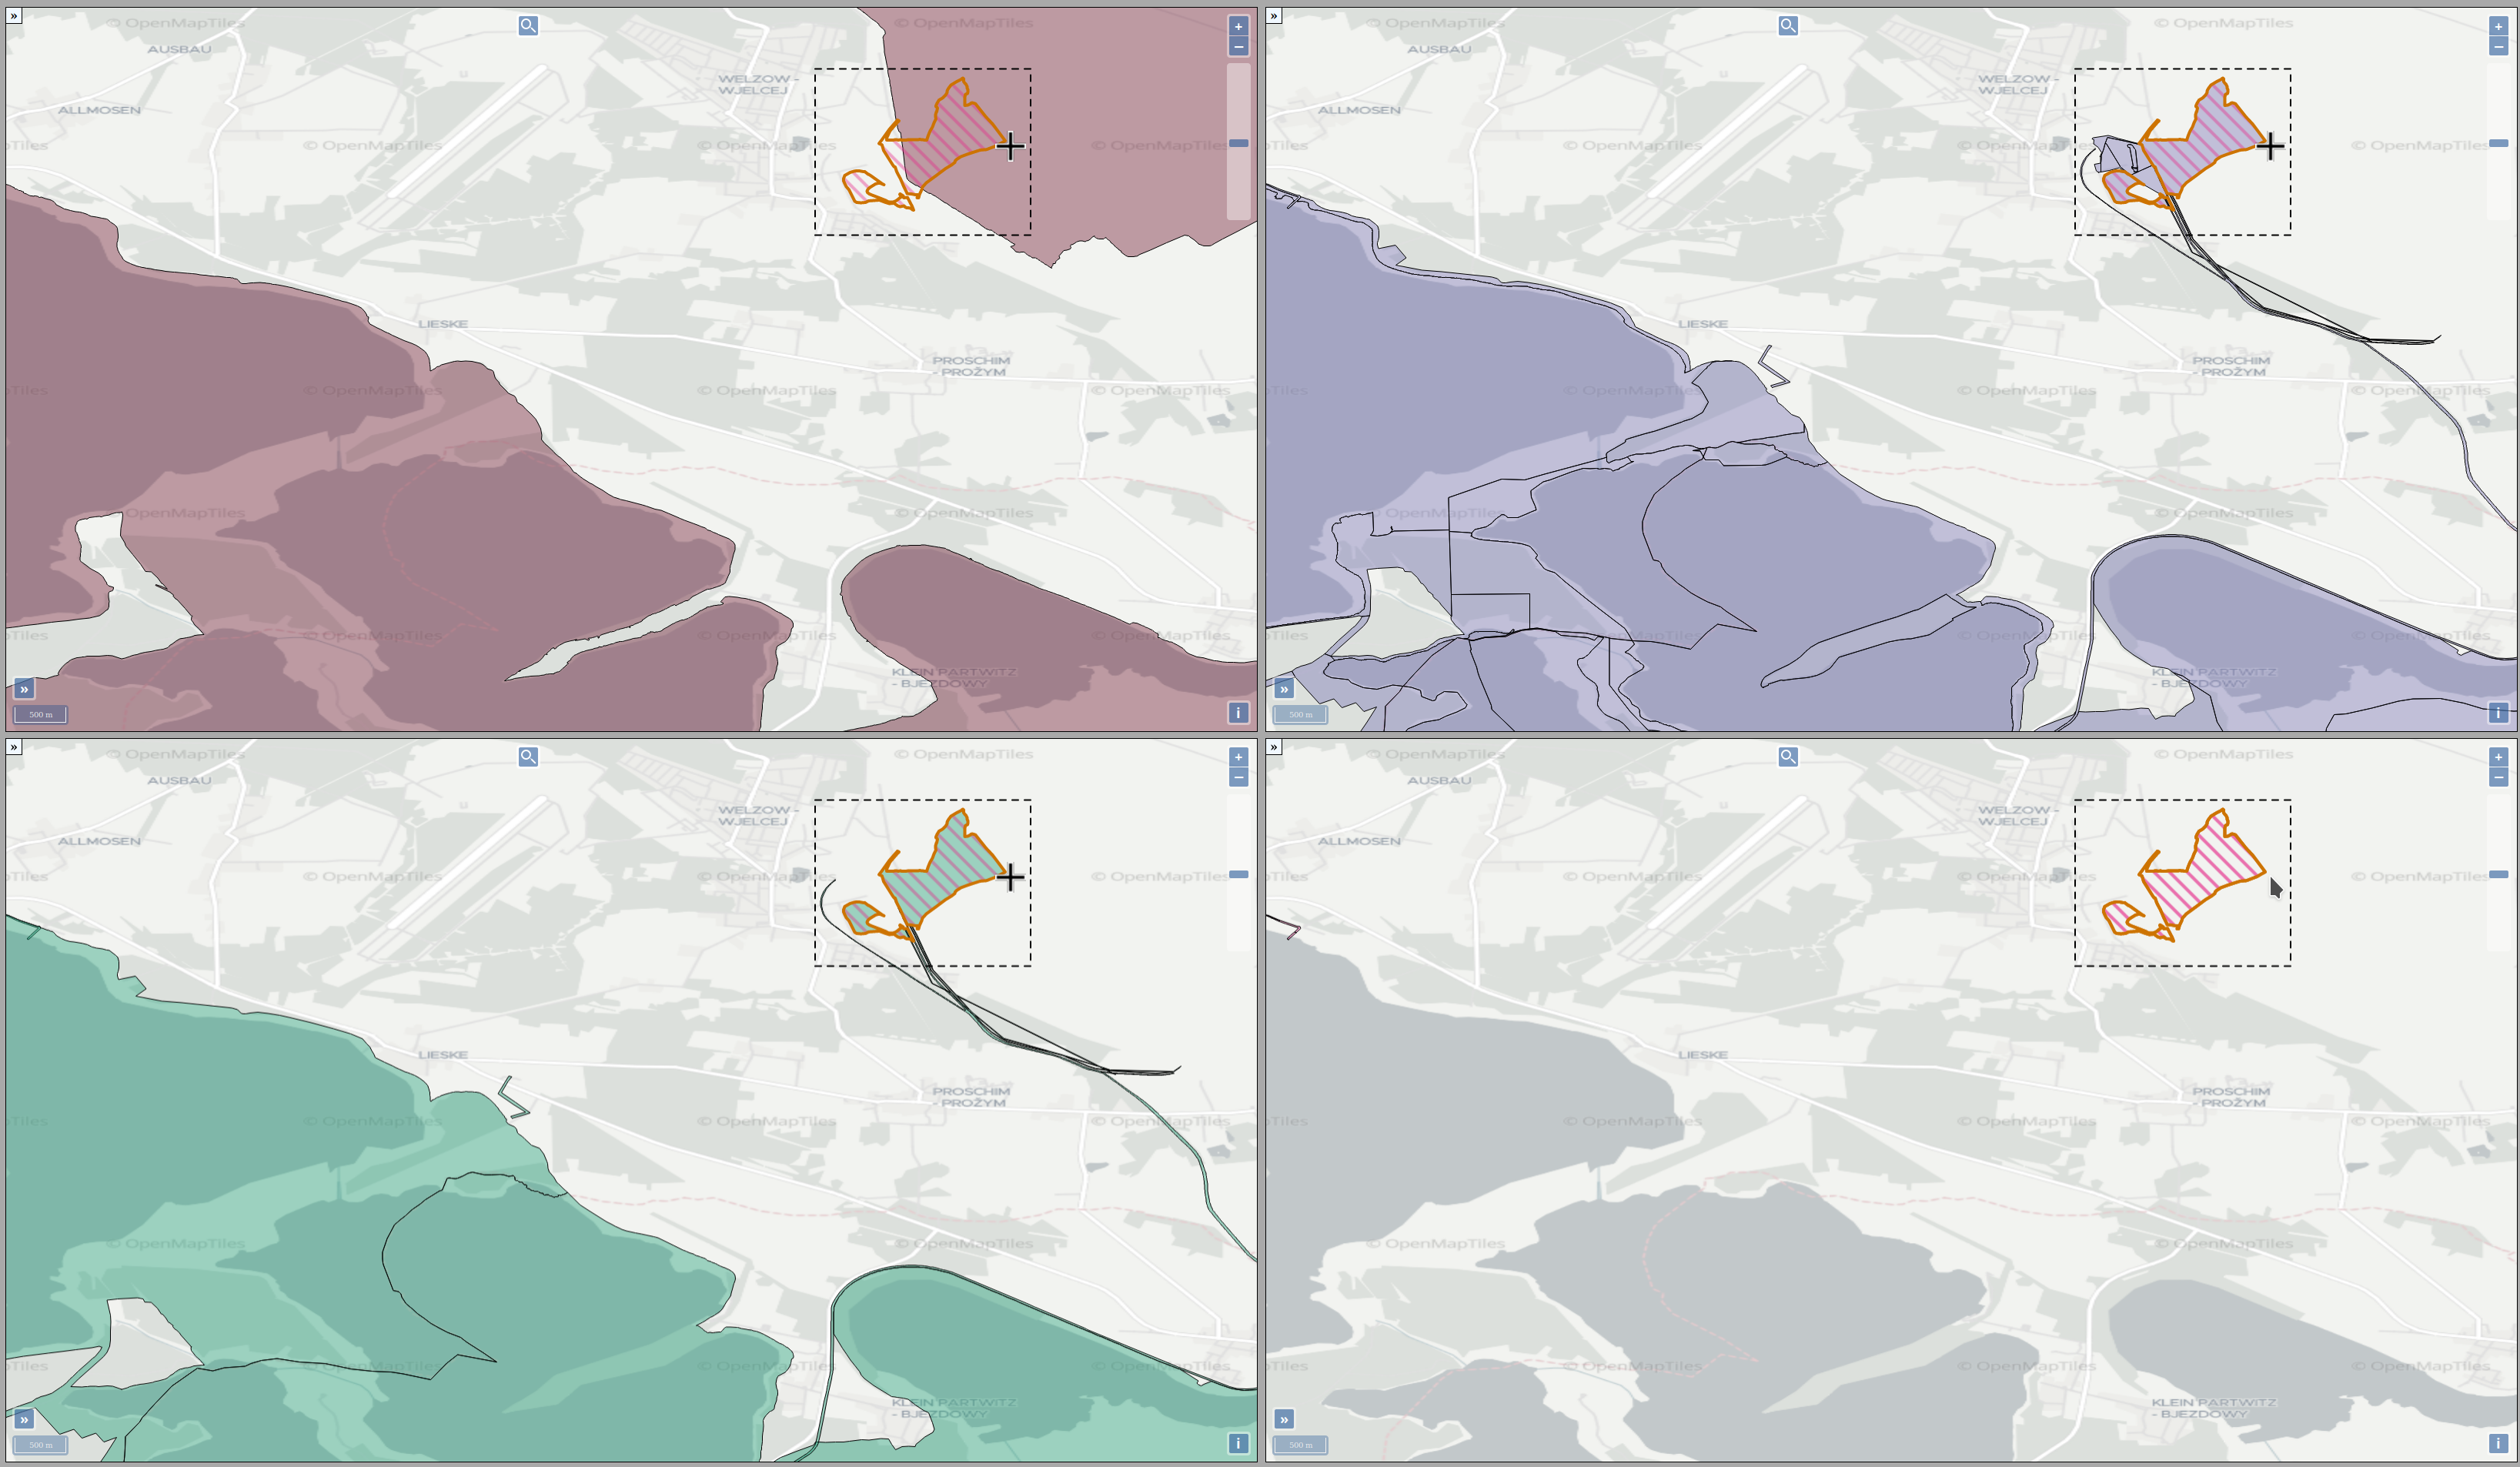
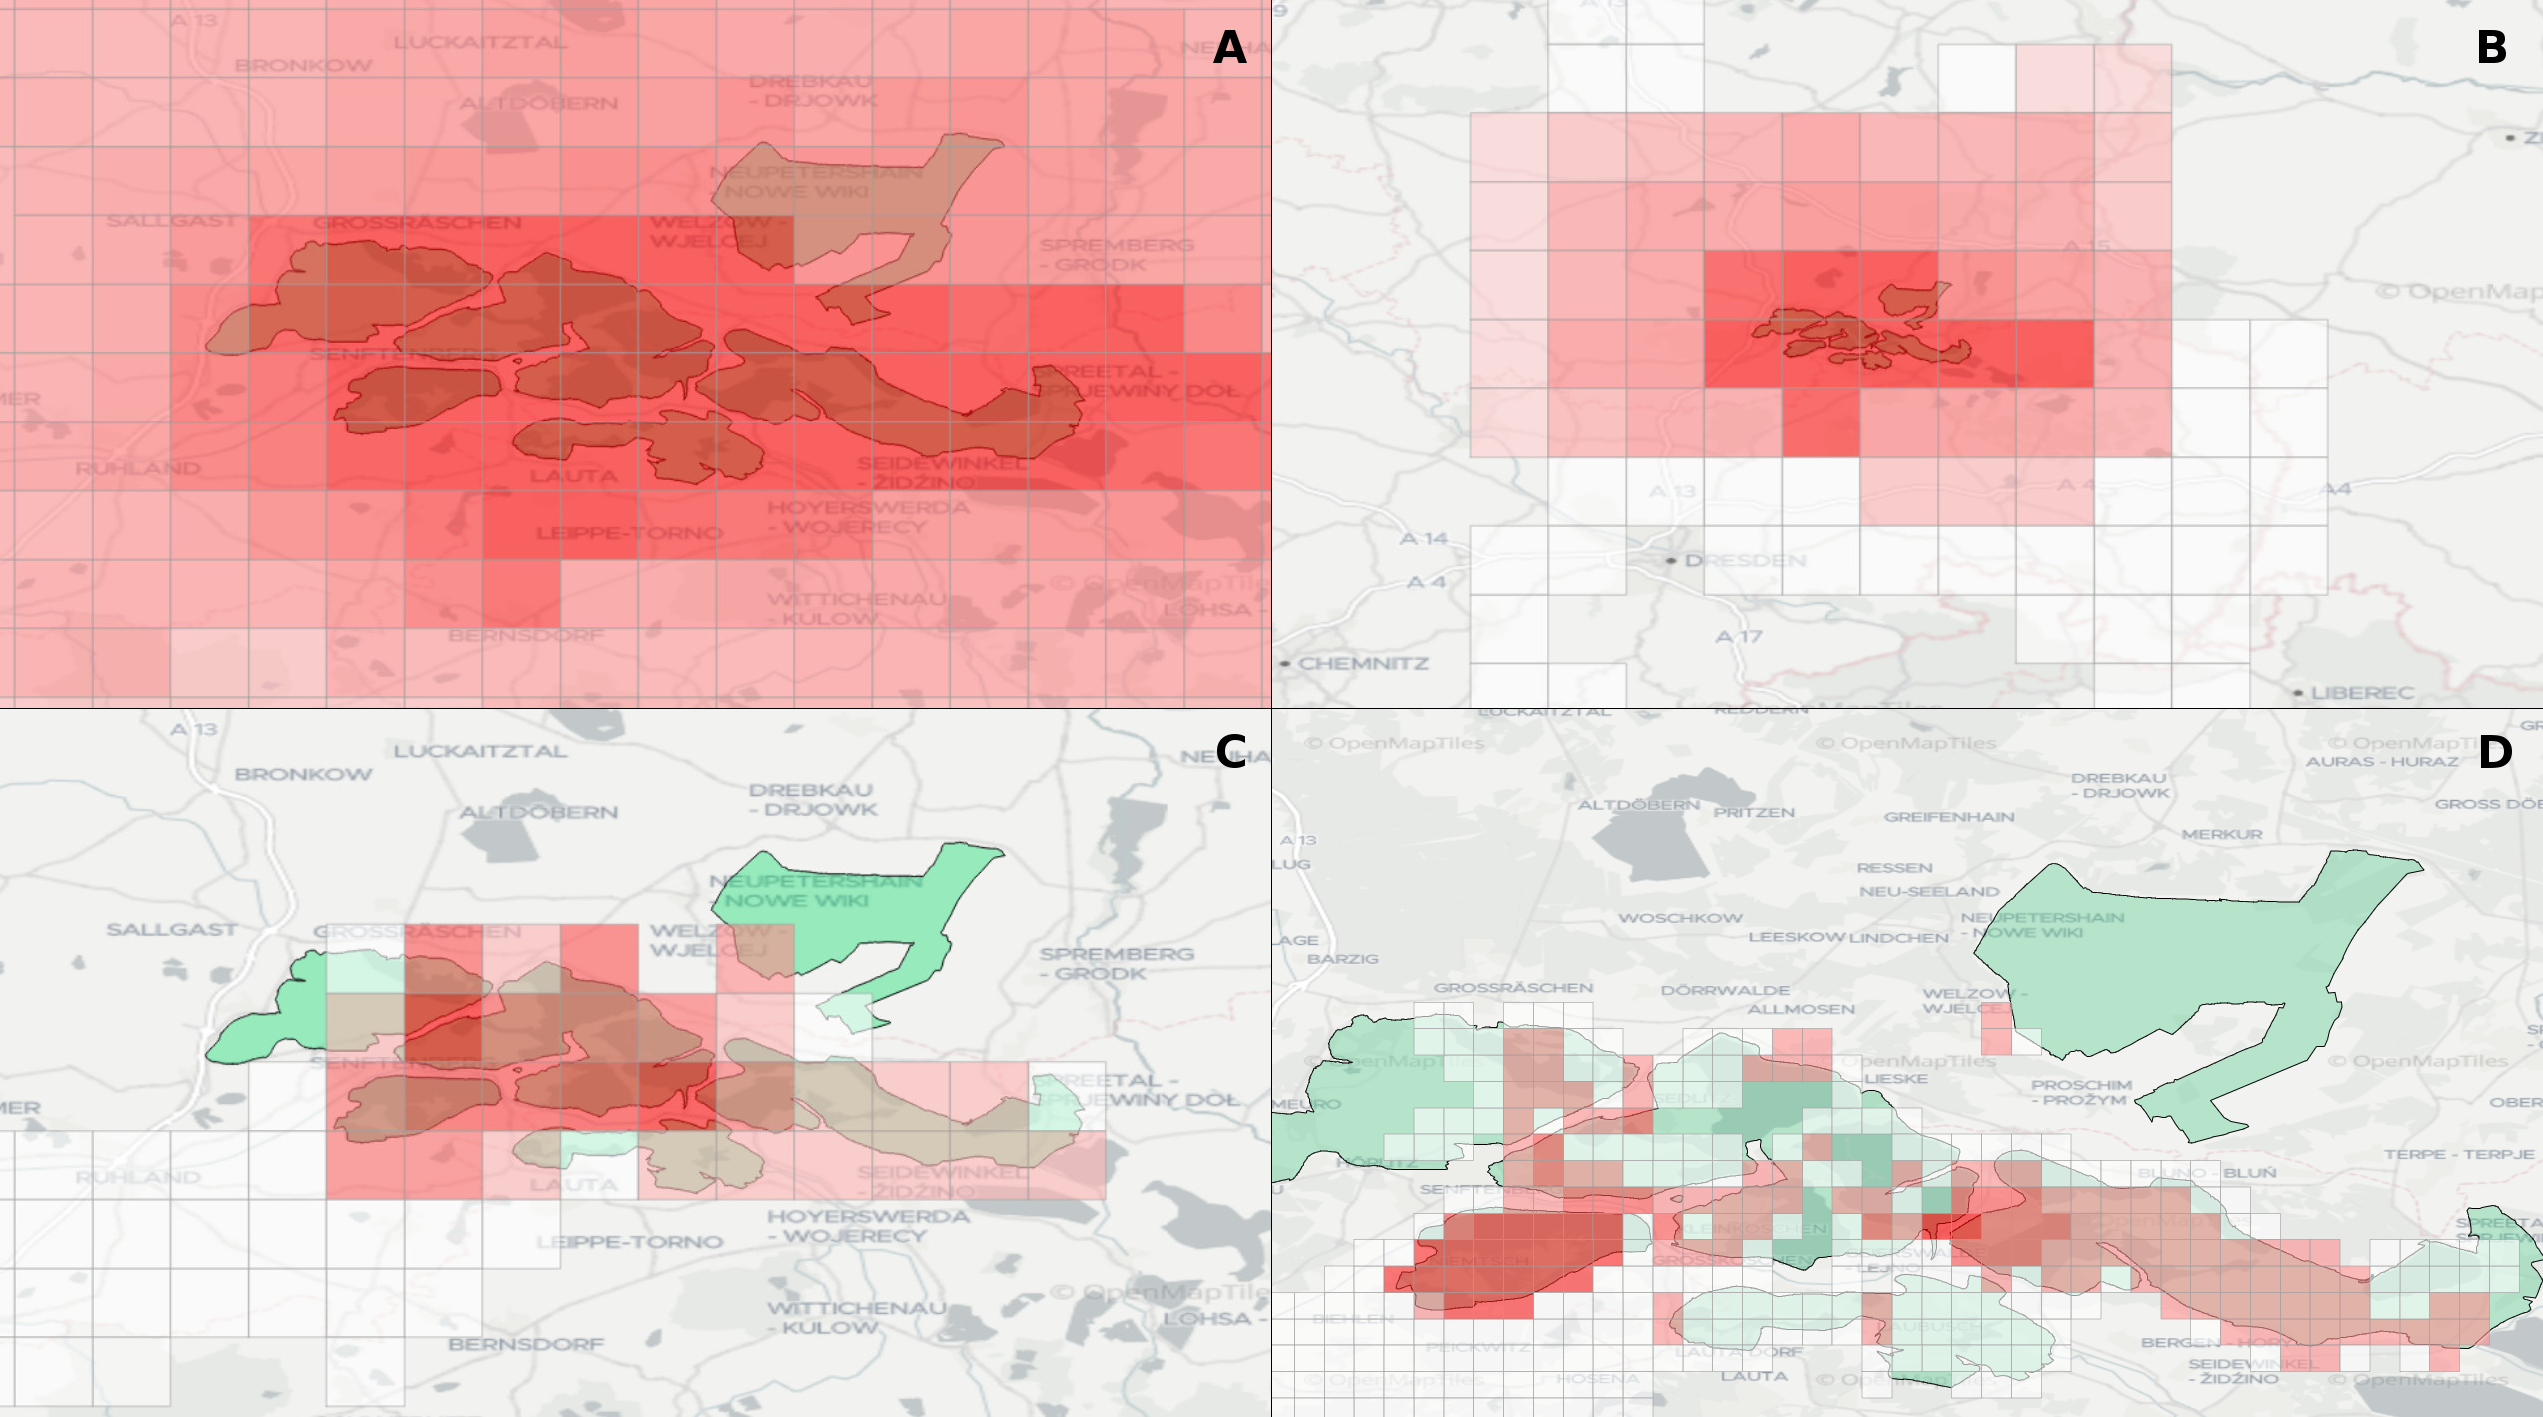
Experts face the task to decide where and how land reuse---transforming previously used areas into landscape and utility areas---can be performed. This decision is based on which area should be used, which restrictions exist, and which conditions have to be fulfilled for reusing this area. Information about the restrictions and the conditions is available as mostly textual, non-spatial data associated to areas overlapping the target areas. Due to the large amount of possible combinations of restrictions and conditions overlapping (partially) the target area, this decision process becomes quite tedious and cumbersome. Moreover, it proved to be useful to identify similar regions that have reached different stages of development within the data set which in turn allows determining common tasks for these regions. We support the experts in accomplishing these tasks by providing aggregated representations as well as multi-coordinated views together with category filters and selection mechanisms implemented in an interactive decision support system. Textual information is linked to these visualizations enabling the experts to justify their decisions. Evaluating our approach using a standard SUS questionnaire suggests, that especially the experts were very satisfied with the interactive decision support system.